Paper 01 · 9 min read · April 28, 2026
We bought 7 years of futures data and asked it 44 questions.
Seven years of MES and MNQ minute bars, eight detectors, one strategy. The 44 findings the desk distilled out — and the five that mattered most.
Window
7 years
Minute bars
~1.8M
Findings logged
44
Detectors built
8
The premise
The desk runs an options strategy on QQQ. It's been live since March 27, 2026 and it's the only thing we route subscriber money through right now. Futures is a separate conversation — one the desk has been having with itself for a while, and one we wanted to put on paper before we talked about it in public.
So we bought seven years of MES and MNQ minute bars, sat down with them, and asked forty-four questions. Forty-four was not the goal. Forty-four is what came back.
We don't trade futures live yet. But if we ever do, this is the foundation we're going to do it on. Public, dated, signed.
The data
Continuous front-month MES and MNQ, 1-minute bars, GLBX.MDP3 feed via Databento. Roughly 1.8 million bars per contract across the window. Cost was contained inside a free trial credit; we did not need a recurring data subscription to ask these questions.
We trimmed every dataset to a single trading window for analysis: 9:30 AM to 12:30 PM Eastern. That's where the desk's attention is and where the edge concentrates. Anything after 12:30 ET is in the data; nothing after 12:30 ET is in the strategy.
The framework
Before we asked anything, we built a small library of detectors — pattern matchers that run over the bars and emit a binary signal when their conditions are met. Eight of them made the cut: VWAP-reclaim, bull flag, W-pattern, volume surge (≥4× baseline), opening-range breakout, horizontal channel breakout, and two legacy “Class A” and “Class B” structural patterns inherited from earlier work.
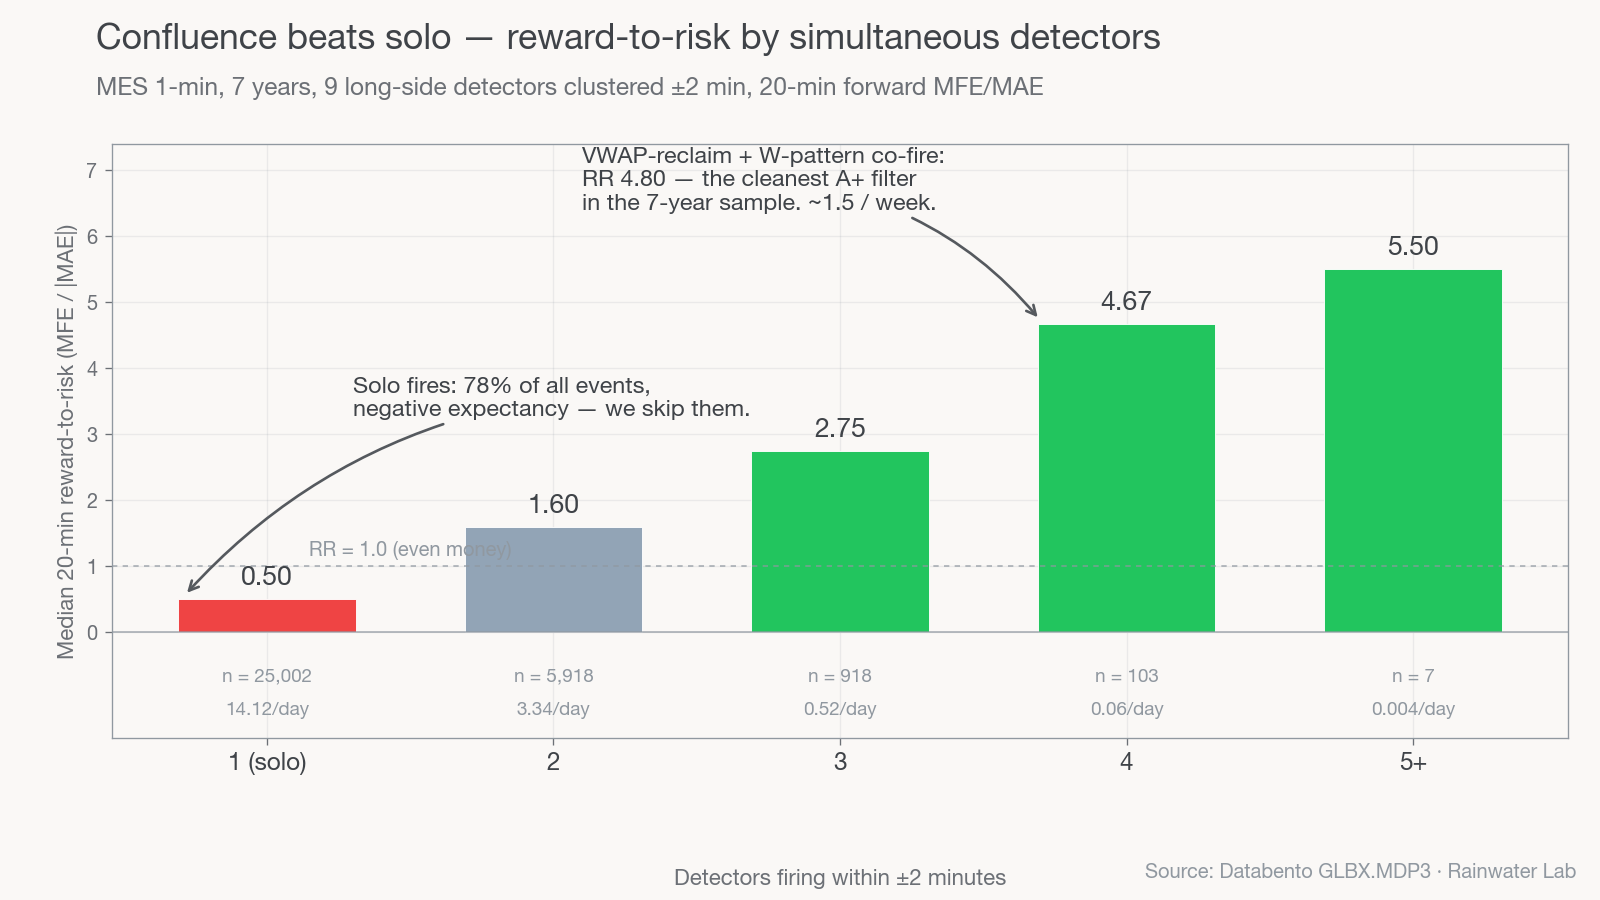
Then a layer over those: confluence. Every minute, we count how many of the eight detectors are firing simultaneously. Zero is silence. One or two is noise. Three is a T2 candidate. Four or more is a T1 — the rare full-stack alignment that, on the data, paid the most per fire.
The five findings that mattered most
Forty-four findings is too many to read in one sitting. Five of them are load-bearing; the rest exist to support, qualify, or rule out these. The cover charts below are each drawn from the full seven-year sample — same data, same window, same NY-time conversion across the whole study.
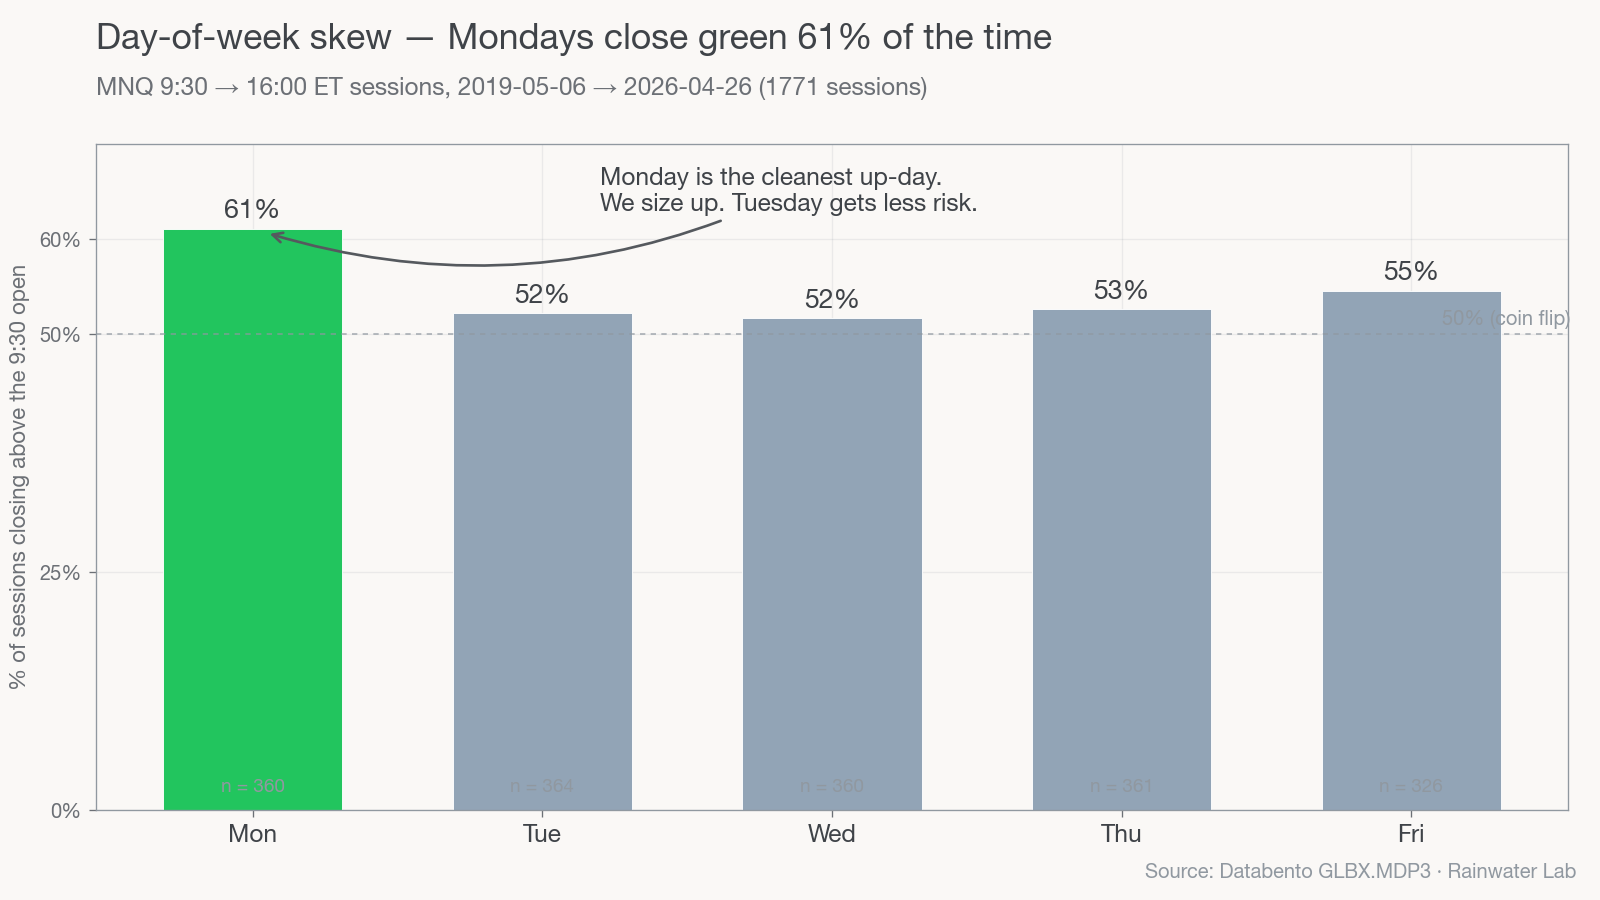
F4 — DOW skew
Mon 61% up
Tuesday only 52%
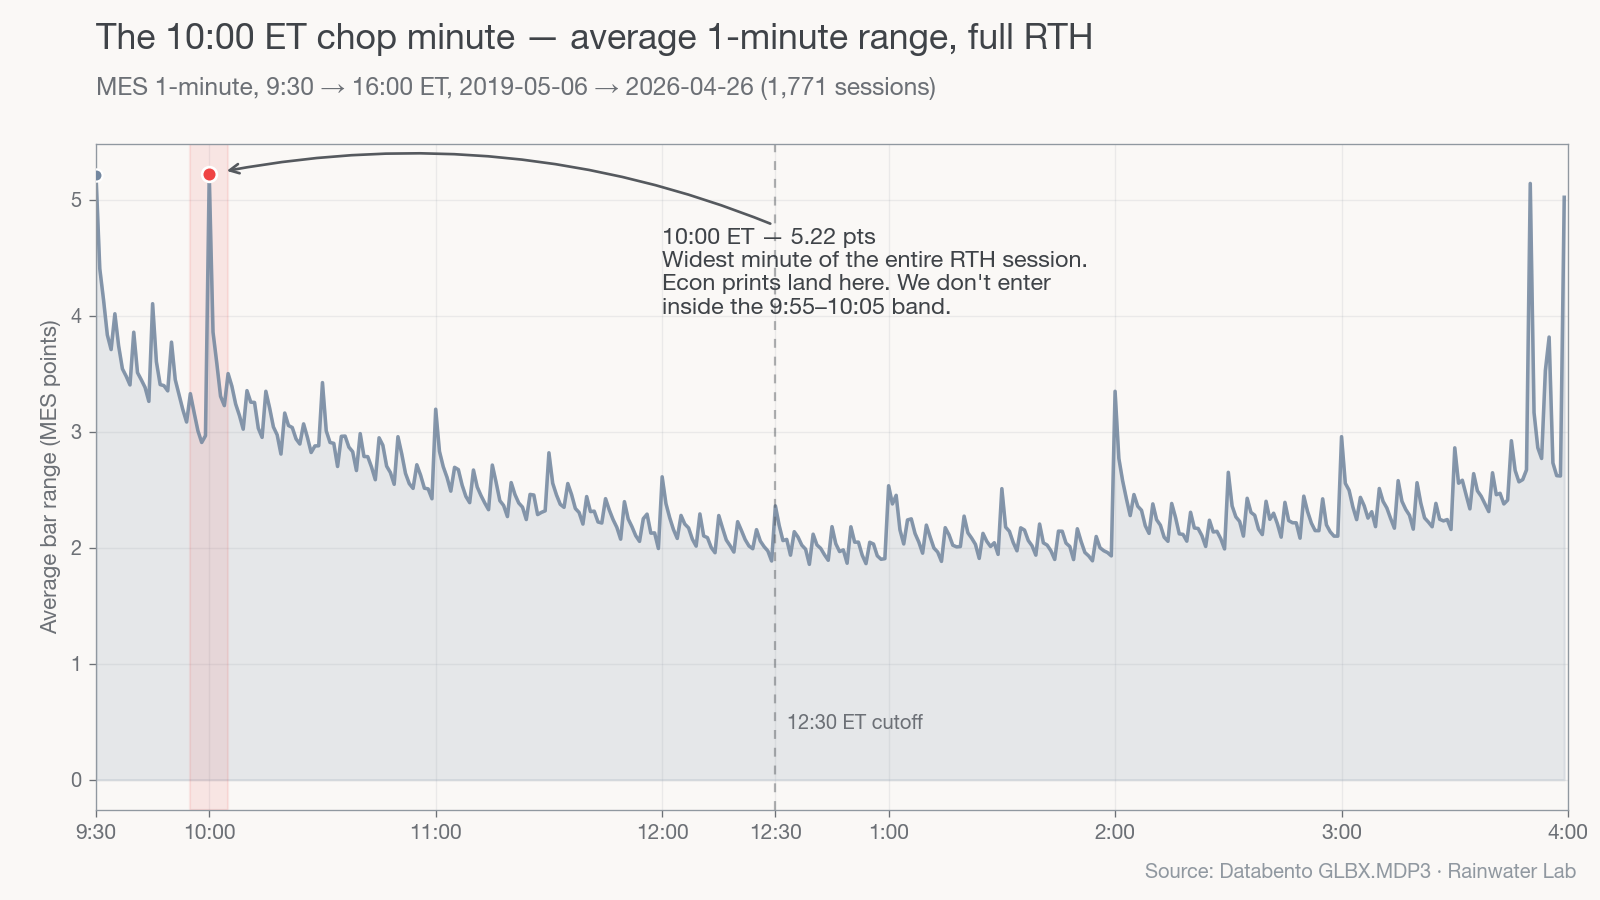
F6 — chop minute
9:55–10:05
Widest 1-min range
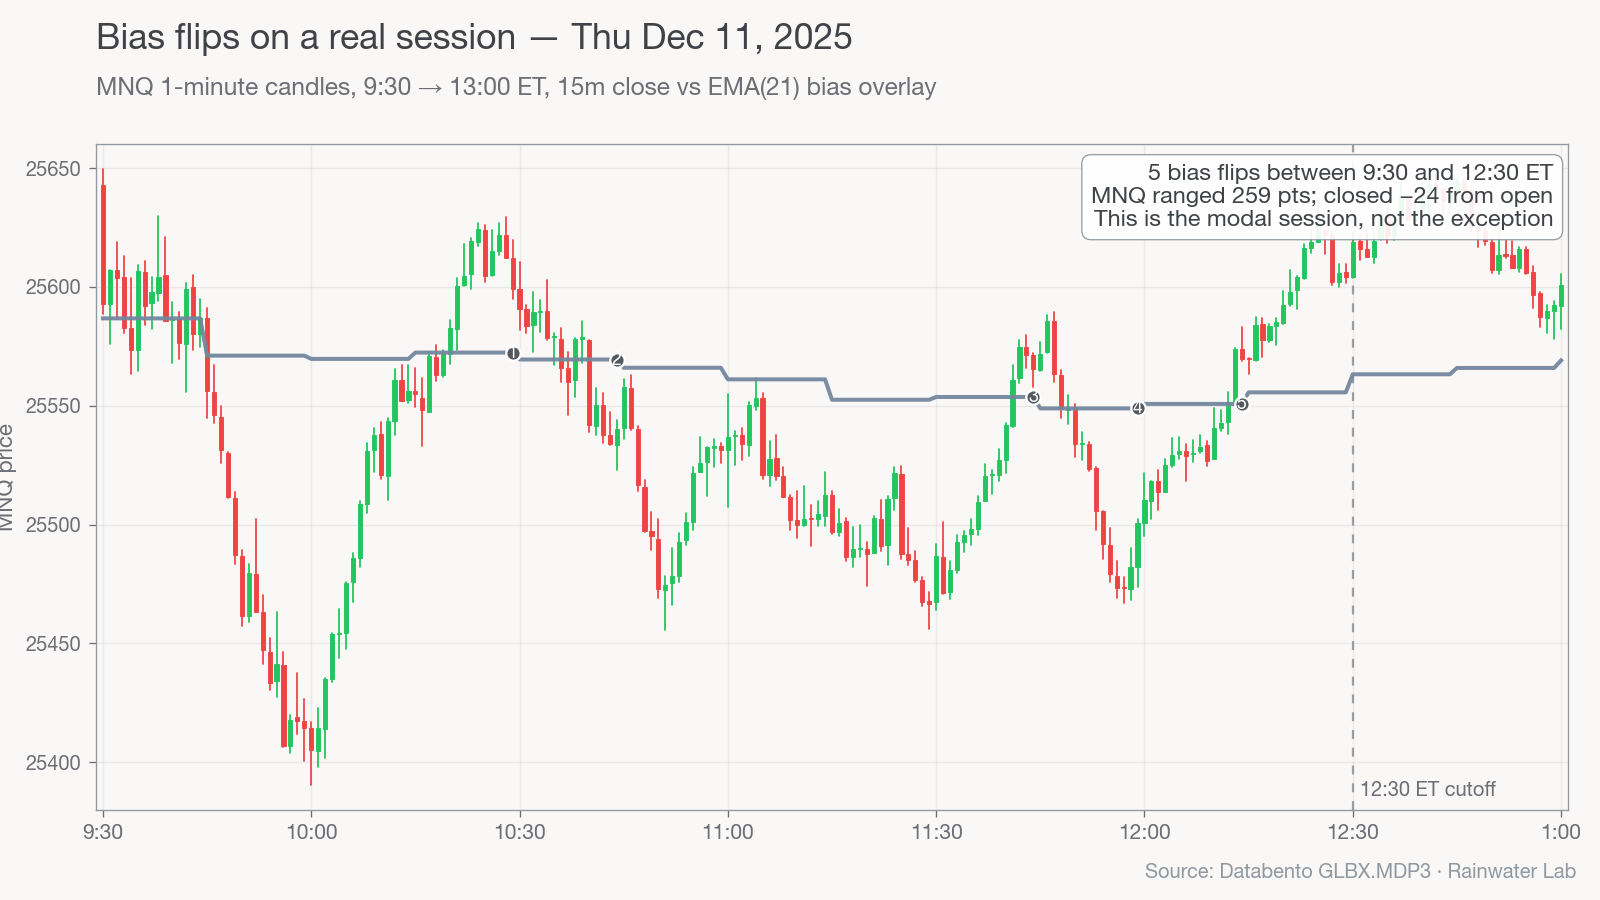
F11 — bias flips
~4-5/day
On 15m EMA-21
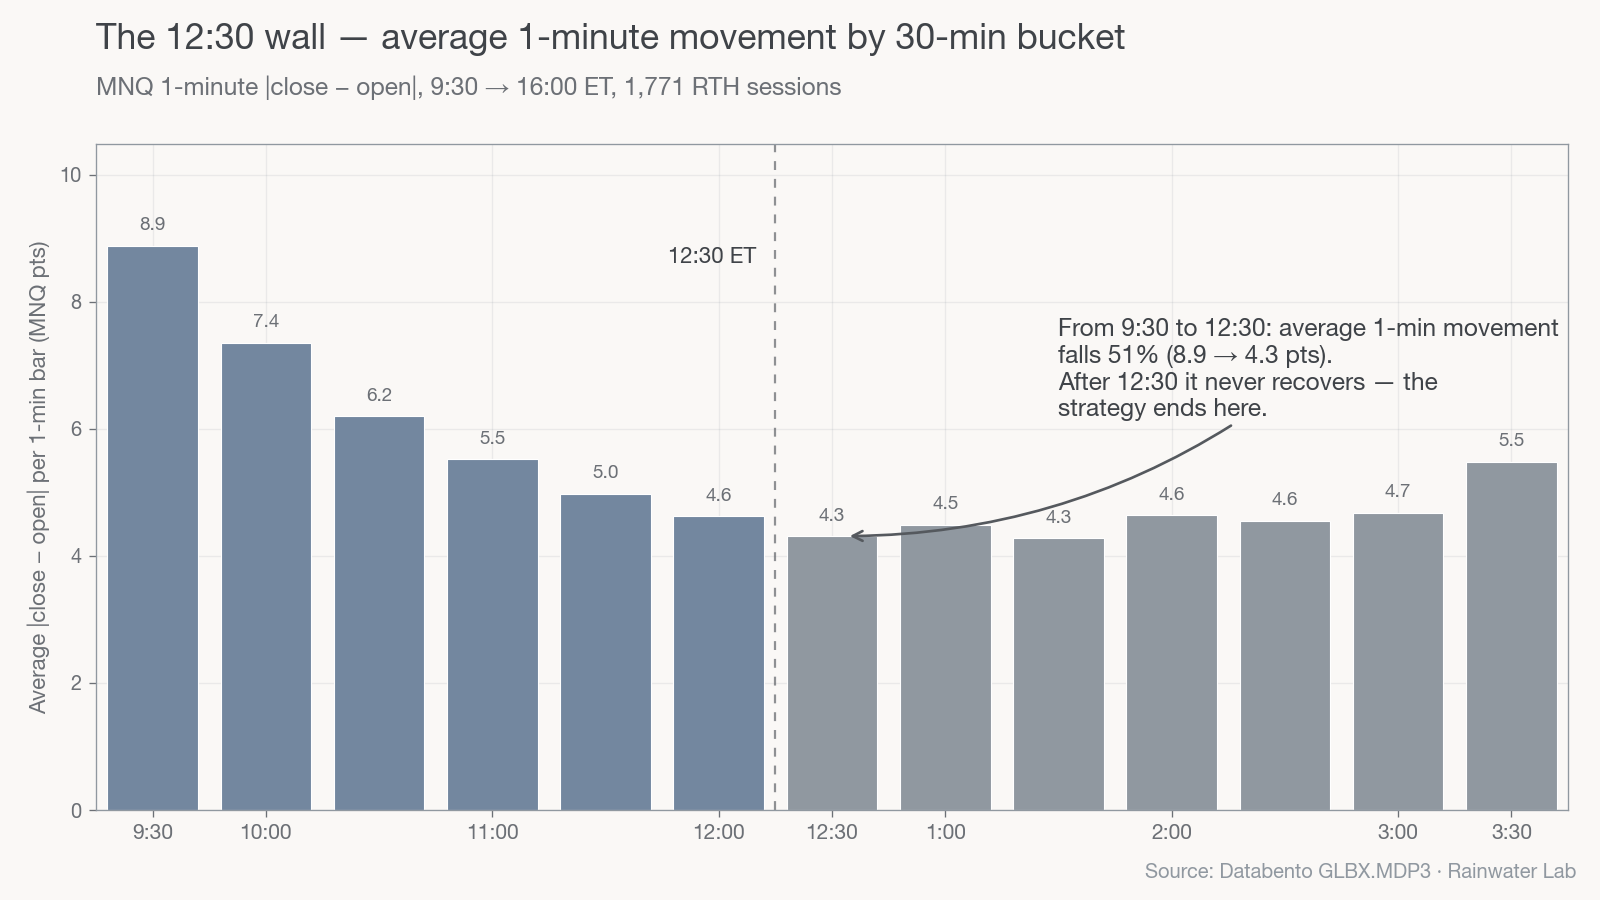
F29 — 12:30 wall
Edge collapses
Hard cut after
F4 — Monday closes green 61% of the time
Monday is the cleanest up-day in the dataset. Tuesday is a coin flip. Wednesday's first 30 minutes are dead. Thursday and Friday are standard. We don't trade Tuesdays the same way we trade Mondays — Monday gets size, Tuesday gets discipline.
F6 — the 10:00 ET chop minute
The single widest one-minute range in the average trading day, by a wide margin, is the minute that brackets 10:00 AM ET — 9:55 to 10:05. On data days that's where the morning's economic prints land. On regular days it's still where the market resets after the opening drive. We don't take new entries inside that ten-minute band.
F11 — the 15-minute bias flips 4-5 times per session
The 15-minute 21-EMA — our trend filter — flips direction roughly 4-5 times per session. That's the headline reason this is a discretionary desk and not an autopilot one. The number tells you how patient you have to be: most flips are noise, a couple are real, and only one or two of those are tradeable.
F29 — the 12:30 wall
Win rate, profit factor, expectancy — every metric we care about falls off a cliff after 12:30 PM ET. We tested every variant we could think of for an afternoon module and none of them paid. The strategy ends at 12:30. Period.
F44 — confluence beats solo
A solo VWAP-reclaim is roughly an even-money fire. A VWAP-reclaim with a W-pattern co-firing has historical reward-to-risk of 4.80. The math doesn't come from anything fancy — it comes from refusing to trade the single-detector candles. The number of detectors agreeing IS the quality filter.
The thirty-nine that didn't make the cover
The other 39 findings are smaller. Some of them rule things out — afternoon FOMC days, gap-up morning fade trades, the relationship between overnight gaps and 9:30 direction, the futility of fighting the bias on a 15-minute reversal. Some of them are texture — the median 1-minute range by hour-of-day, the empirical hold time at which expectancy plateaus (it's twenty minutes, give or take), the fact that volume surge alone correlates 88% with the legacy Class B signal.
We're not going to walk through all of them in a single paper. Some get their own write-ups in this Lab. The point of the count is the count itself: most of what we looked for, we ruled out. The five that are left are the strategy.
What's next
This paper is the cover. The next three in the Lab go deeper:
- Paper 02 — MNQ vs MES, per dollar of risk. Same strategy, two contracts, very different P&L per dollar at risk.
- Paper 03 — The five A+ setups. What they look like, what they win, and how often they show up.
- Paper 04 — What we don't trade and why. The discipline paper.
When the desk eventually runs futures live, this is the foundation it'll be running on. If you'd like to be on the list when that happens, the form below is the way.
Futures waitlist
We're not running futures live yet. When we do, you'll be the first to know.
The research above is what we measure before we run a single dollar of subscriber money. Drop your email if you want first access when MNQ goes live on the desk.
Email only used for futures launch notifications. Unsubscribe any time.