Paper 03 · 8 min read · April 28, 2026
The five A+ setups that pay.
Most setups don't pay. Five do. The ones the desk takes at full size, what they win, what they cost, and how often they show up.
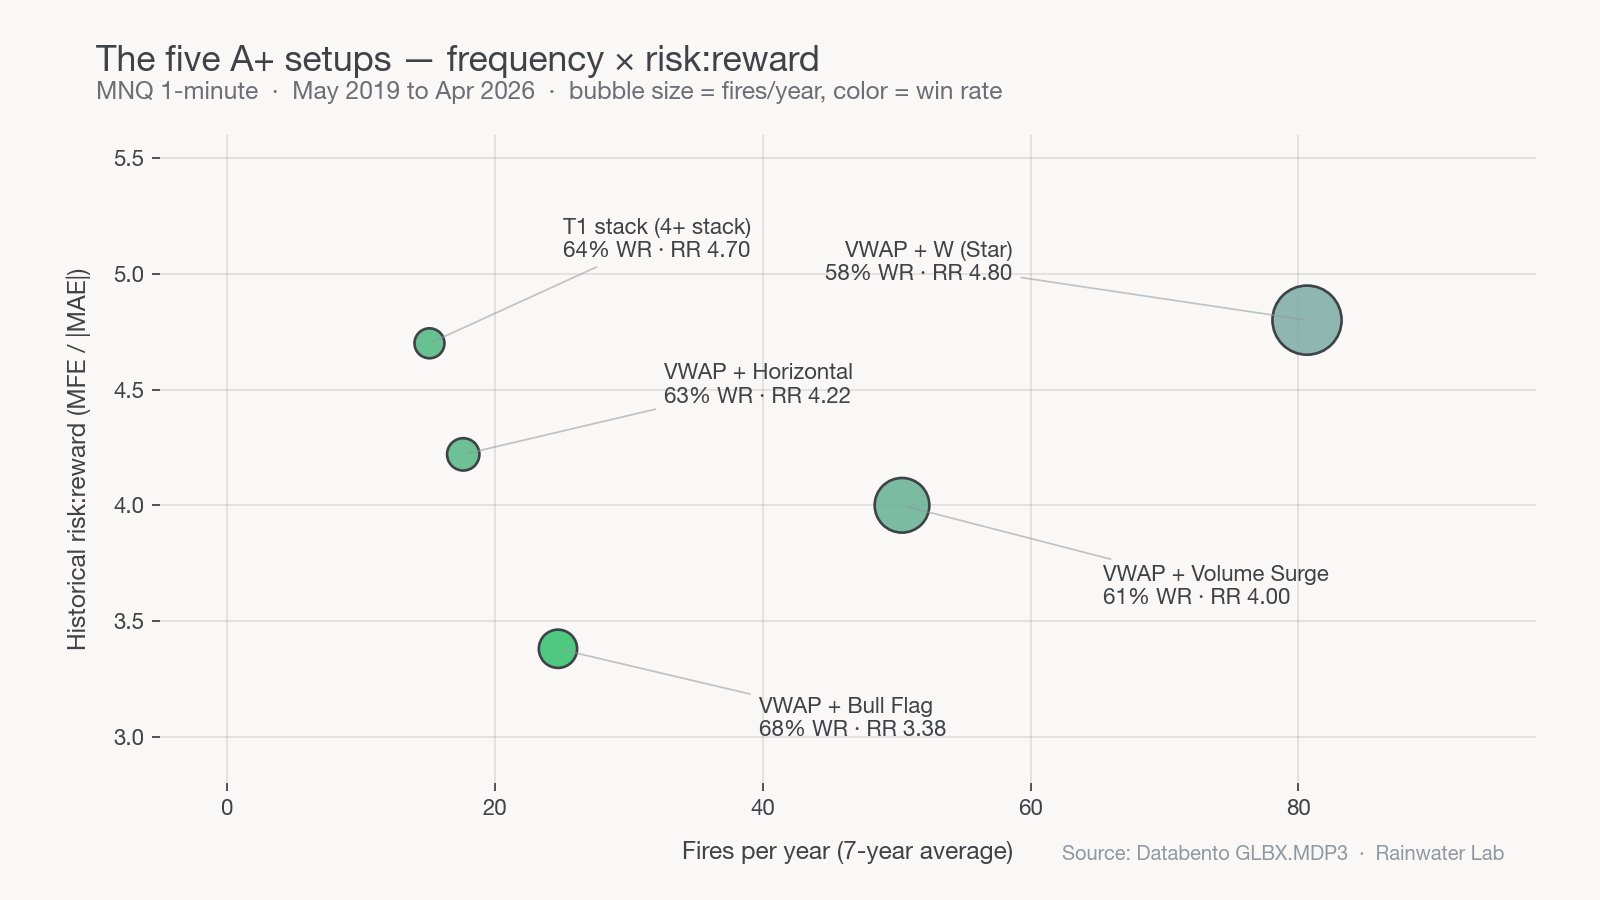
VWAP + W
RR 4.80
VWAP + Horiz
RR 4.22
VWAP + VolSurge
RR 4.00
VWAP + Bull Flag
173 fires / 7yr
Setups don't pay. Confluence does.
The most important finding in the entire futures research file is that no single detector pays well on its own. A solo VWAP-reclaim is roughly an even-money fire. A solo bull flag is a tossup. A solo volume surge is noise. The setups that win at tradeable RR are setups where two or more detectors fire on the same minute.
These are the five combinations that the seven-year dataset isolates as A+: the handful that, when you only take them, give you the headline 64% win rate and the 1.93 profit factor.
The five A+ setups
Star — VWAP + W
58% WR / RR 4.80
~0.32 fires/day
VW + Horizontal
63% WR / RR 4.22
~0.07 fires/day
VW + Volume Surge
61% WR / RR 4.00
Tightest expectancy
VW + Bull Flag
68% WR / RR 3.38
The workhorse
The fifth tag is T1 — any minute on which four or more of the eight detectors fire simultaneously, regardless of which four. It's rare (roughly 0.06 fires per day) but the historical RR is ~4.7 — when the entire stack lines up, you take it.
The five setups, with examples
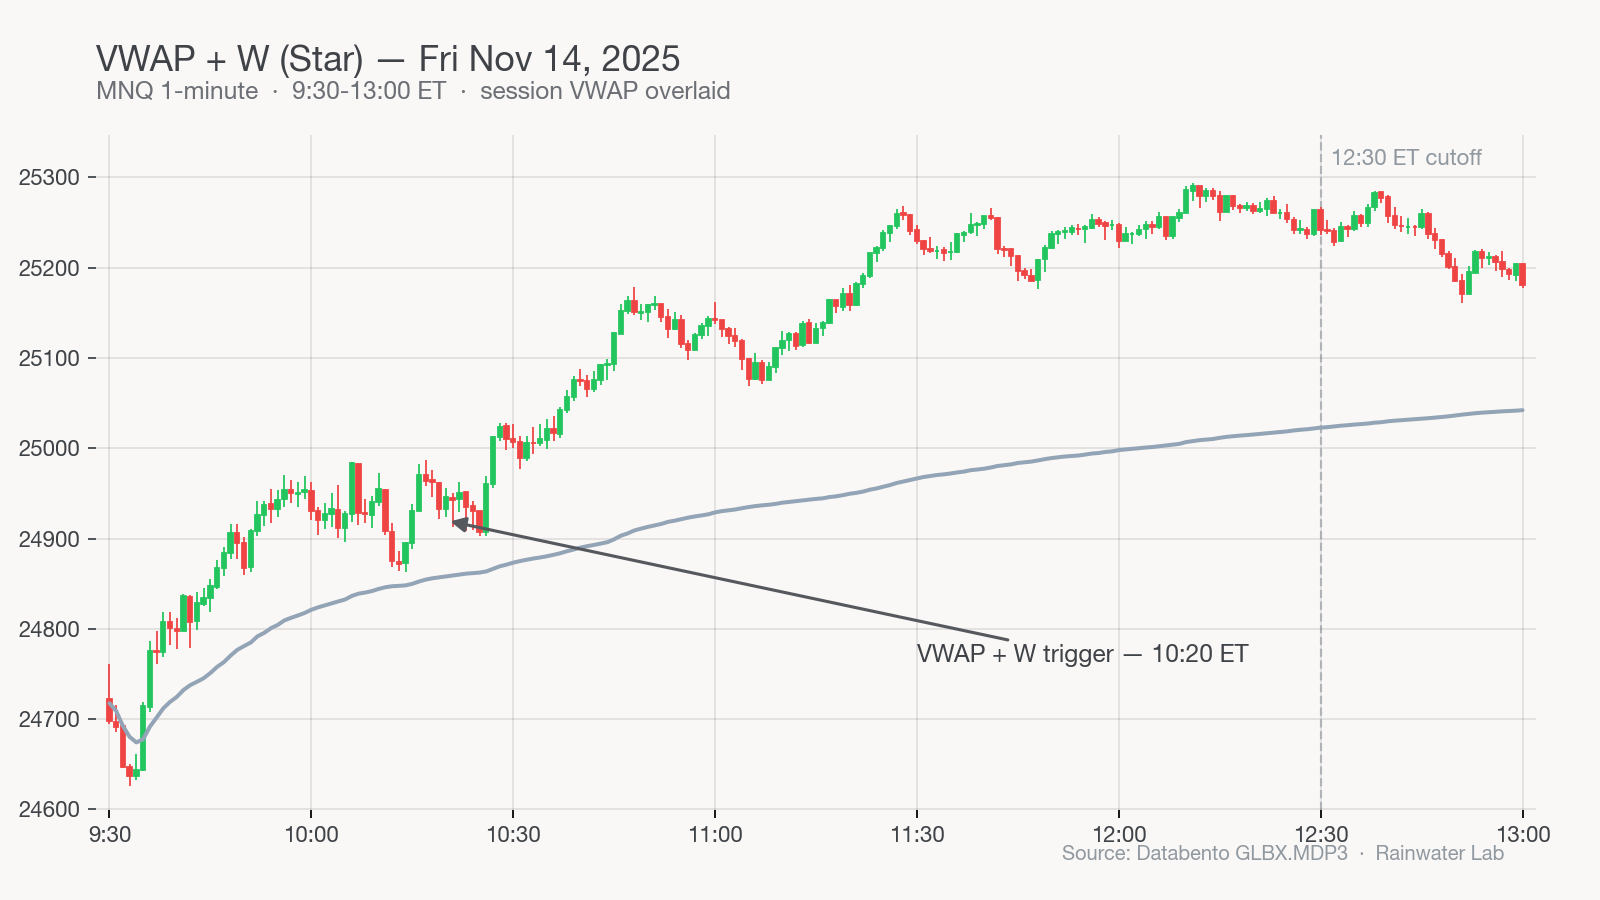
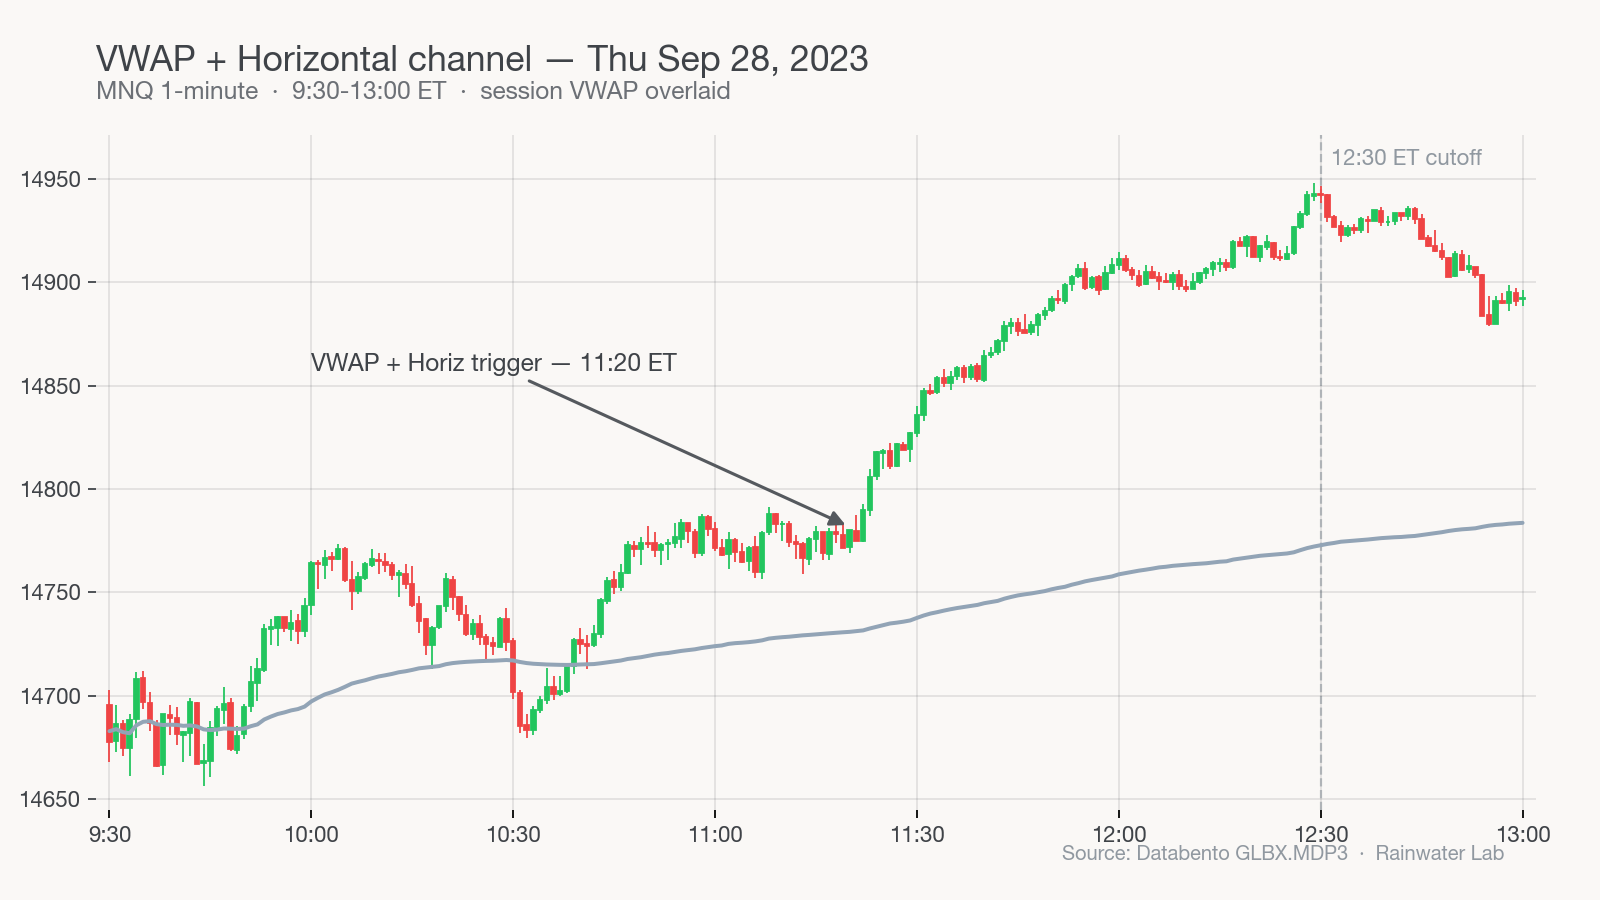
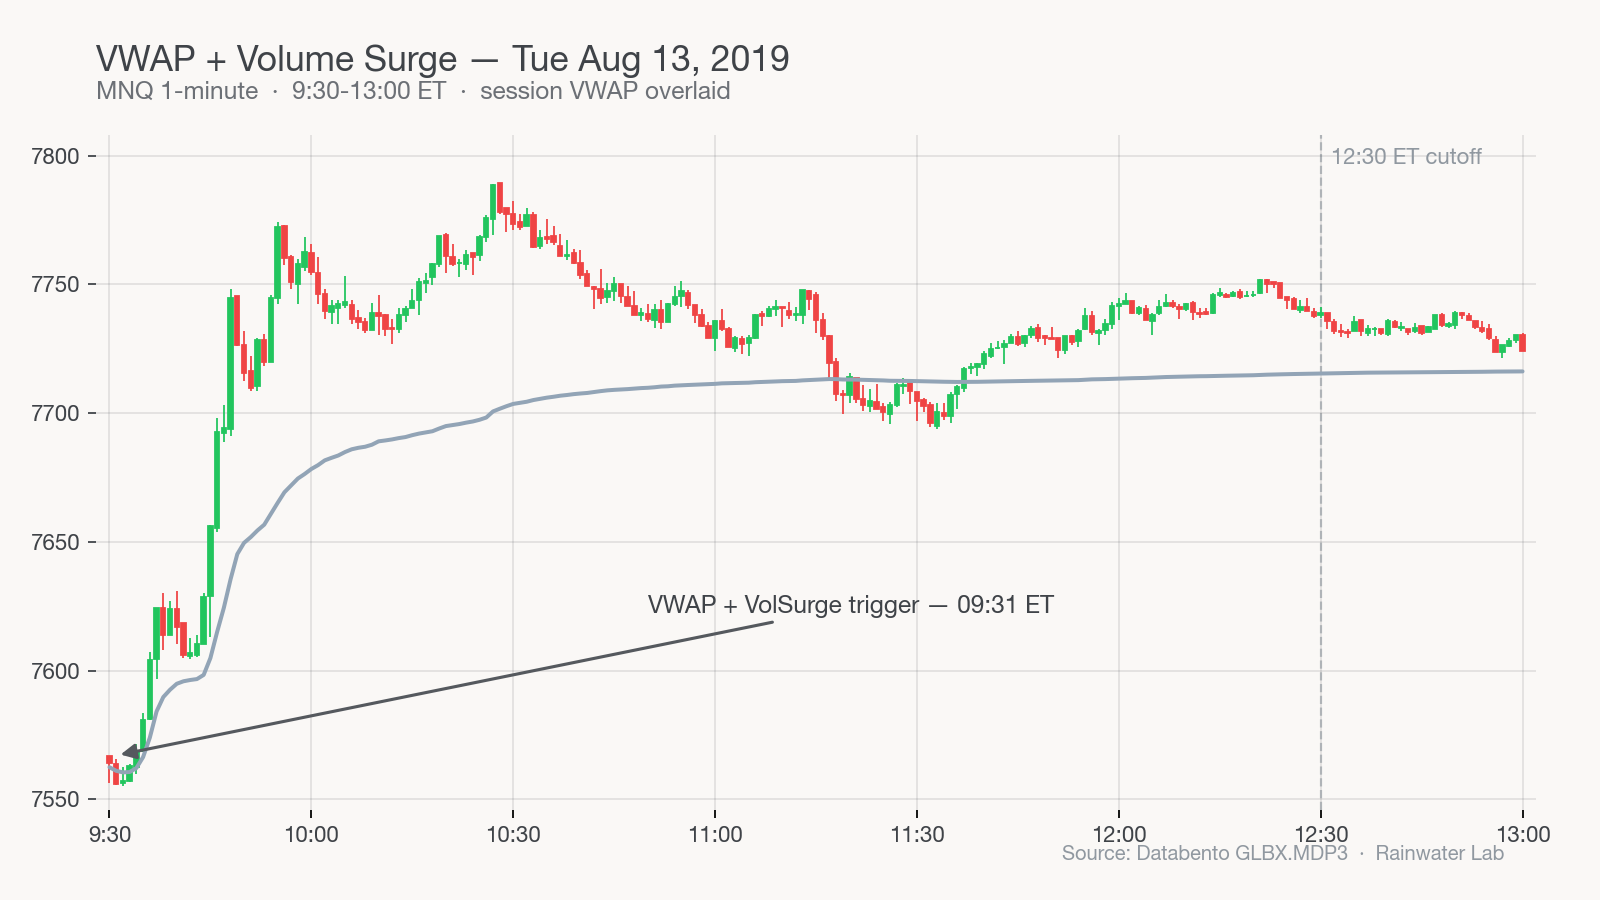
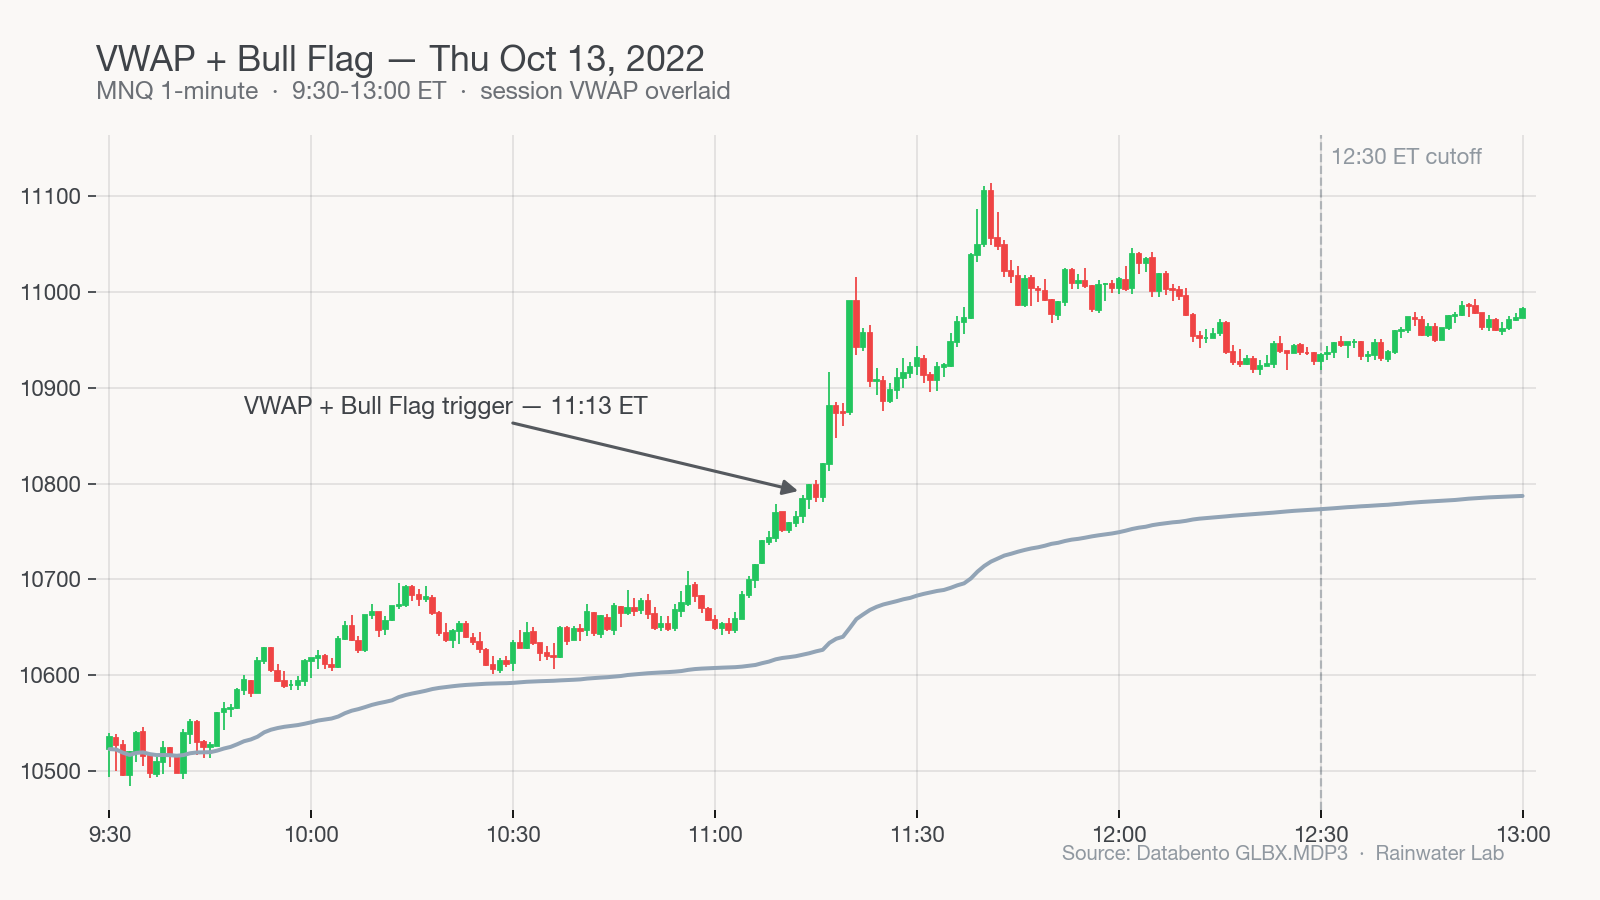
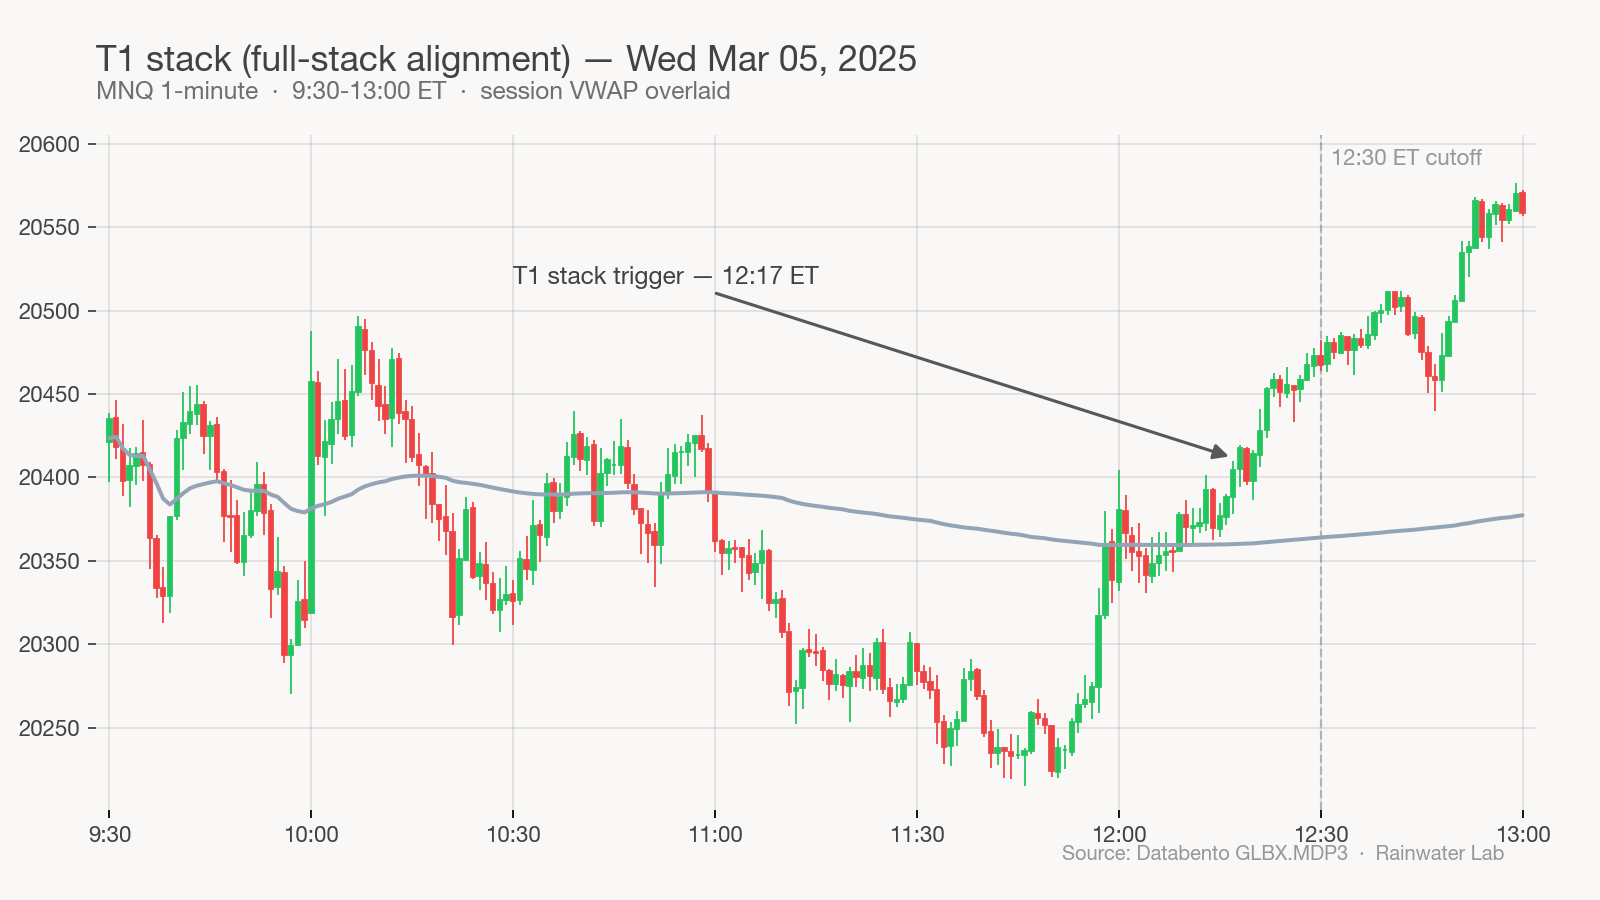
Each setup below is followed by a real example from the seven-year dataset — a clean session that fired the setup and held the long thesis through 12:30 ET. Charts are MNQ 1-minute bars, 9:30–13:00 ET, with session VWAP overlaid. The arrow points to the trigger bar.
1. VWAP + W — the Star (highest RR)
The highest-RR setup we've measured. ~0.32 fires per day, 58% win rate, RR 4.80. The pattern: a clean W on price after a reclaim of VWAP, with the right leg of the W breaking back above the neckline. The asymmetry is what makes the RR — the stop sits below the right-leg low, the target sits well above the W's neckline, and the move that follows is usually the day's main impulse.
Frequency: ~0.32 fires/day · Win rate: 58% · Historical RR: 4.80
2. VWAP + Horizontal channel breakout
When price has bounded between two horizontal levels above VWAP for at least 15 bars, the breakout of the upper band with VWAP still in support is a 63% / RR 4.22 setup. Rare — about 0.07 fires per day — but extremely clean when it shows up. The pre- breakout consolidation is a coiled spring; the breakout fires the long.
Frequency: ~0.07 fires/day · Win rate: 63% · Historical RR: 4.22
3. VWAP + Volume Surge
A VWAP-reclaim minute on which the most recent bar's volume is at least 4× the rolling baseline. 61% WR, RR 4.00. It's the lowest of the four named combos but it has the tightest stop-to-target ratio and the most evenly distributed win distribution — fewer outsized wins, fewer outsized losses, smoother equity curve.
Frequency: ~0.20 fires/day · Win rate: 61% · Historical RR: 4.00
4. VWAP + Bull Flag — the workhorse
One hundred and seventy three fires across seven years. 68% win rate. RR 3.38. It's not the highest expected value per fire — that's the W-pattern combo — but it's the single biggest dollar contributor to the strategy because it shows up most often. Visually: price has come back through VWAP from below, then spent a few minutes consolidating in a tight range with the prior swing. That tight consolidation is the bull flag. The minute it breaks the upper edge with the VWAP still under it is the fire.
Frequency: 173 fires / 7 years · Win rate: 68% · Historical RR: 3.38
If you only ever traded VWAP+BF, you'd capture roughly 43% of the entire strategy's historical P&L. It's the load-bearing setup.
5. T1 stack — full-stack alignment
Any minute on which four or more of the eight detectors fire simultaneously, regardless of which four. It's the rarest setup in the list — roughly 0.06 fires per day — but the historical RR is ~4.7. When the entire stack lines up, you take it. Most T1 fires occur in the first 30 minutes, but the example below is a midday trigger to show the convergence isn't gated to the open.
Frequency: ~0.06 fires/day · Win rate: 64% · Historical RR: 4.7
How the desk reads them
We don't ask the trader to memorize five separate playbooks. The TradingView indicator we built for this strategy renders each combo as a tagged label on the bar where it fires. Star icon for VWAP+W, gold “A+” for the T1 four-stack, teal labels for the other three.
The decision is binary: marker on the bar, bias-aligned, before 12:30, not in the chop minute, not in cooldown — fire. No marker — pass. The rules collapse the framework into an action.
What you'll see in the next paper is the inverse: the setups the indicator doesn't mark, and why ignoring them is the difference between a 64% win rate and a 51%.
Futures waitlist
We're not running futures live yet. When we do, you'll be the first to know.
The research above is what we measure before we run a single dollar of subscriber money. Drop your email if you want first access when MNQ goes live on the desk.
Email only used for futures launch notifications. Unsubscribe any time.