Paper 06 · 12 min read · May 1, 2026
Above the eight.
We tested eight regime classifiers across seven years of daily NQ data. The simplest one — is daily close above its 8-period EMA? — beats Paper 05's percentile rule on every measurable axis. Paper 05's days are a 97.6% subset of this paper's days. We're retiring the percentile gate on flip day.
Days flagged
899 / 1,768
Holds-30 rate
79.1%
Random-control
99.0th pct
7-year lift @ 2×
+$51,328
The question Paper 05 left open
Paper 05 found one durable rule: when the past five trading days on NQ have been in the strongest 30 % of the trailing year, double A+ contract size. That rule prints +$28,850 over five out-of-sample years and survives every robustness test we ran.
But the founder asked the obvious follow-up. Is there a way to identify regimes more broadly — extended pullback windows, places to lean short, days where the desk should sit out? Could a single moving average do the work that Paper 05's percentile rule does, but more simply, on more days?
The answer turned out to be yes. The simplest classifier we tested — one EMA, one comparison — beats Paper 05's percentile rule on every measurable axis. Paper 05's days are a 97.6 % subset of the new rule's days. We're retiring the percentile gate on flip day.
The method — eight classifiers, one economic test
We tested every reasonable single-feature regime classifier on daily NQ across the same 7-year window:
- EMAs at 8, 21, 34, 50, 100, 200 bars. For each span: price-above-EMA, slope direction, cross signals, and combined gates.
- Pre-market direction bucketed into five magnitudes (strong-up to strong-down) — the founder's hypothesis that pre-market down moves reverse harder than pre-market up moves.
- Pullback families — day-after-strong-rally, 5-day-up with 1-day-down (consolidation), low-vol-in-trend (ATR(5) < ATR(20)), premarket-pullback gates.
- Extended pullback regime — 1-day return negative AND price below EMA-21 AND realized vol elevated.
- Composite labels across {trend-up, drift-up, range, pullback-in-up, extended-pull, trend-down} built by stacking the above.
For each classifier we ran the full Paper 05 protocol: walk-forward per-year out-of-sample, 500 per-year-stratified random controls with the same N, multiple-comparison correction (Bonferroni and Benjamini-Hochberg), and an economic test against V_FINAL's actual MNQ trade log over five OOS years. A classifier had to clear random-controls at the 95th percentile to count as real edge.
The convergent finding — above the eight
Days flagged
899 / 1,768
50.8% of all sessions
Holds-30 rate
79.1%
vs 69.7% baseline
z-test on holds
5.13
p = 2.84e-7, Bonferroni-clean
Yrs better than baseline holds
8 of 8
complete unanimity
A single feature dominates. If yesterday's NQ daily close is above its 8-period exponential moving average, today's long VWAP-reclaim setups hold 30+ minutes 79.1 % of the time vs 69.7 % on all other days. No fitting, no thresholds, no parameters — just one comparison evaluated at the open. The lift is 8 of 8 years stable on holds rate, 7 of 8 years stable on dollar P&L (the one miss is 2026, a 64-day partial year that is universally negative for V_FINAL).
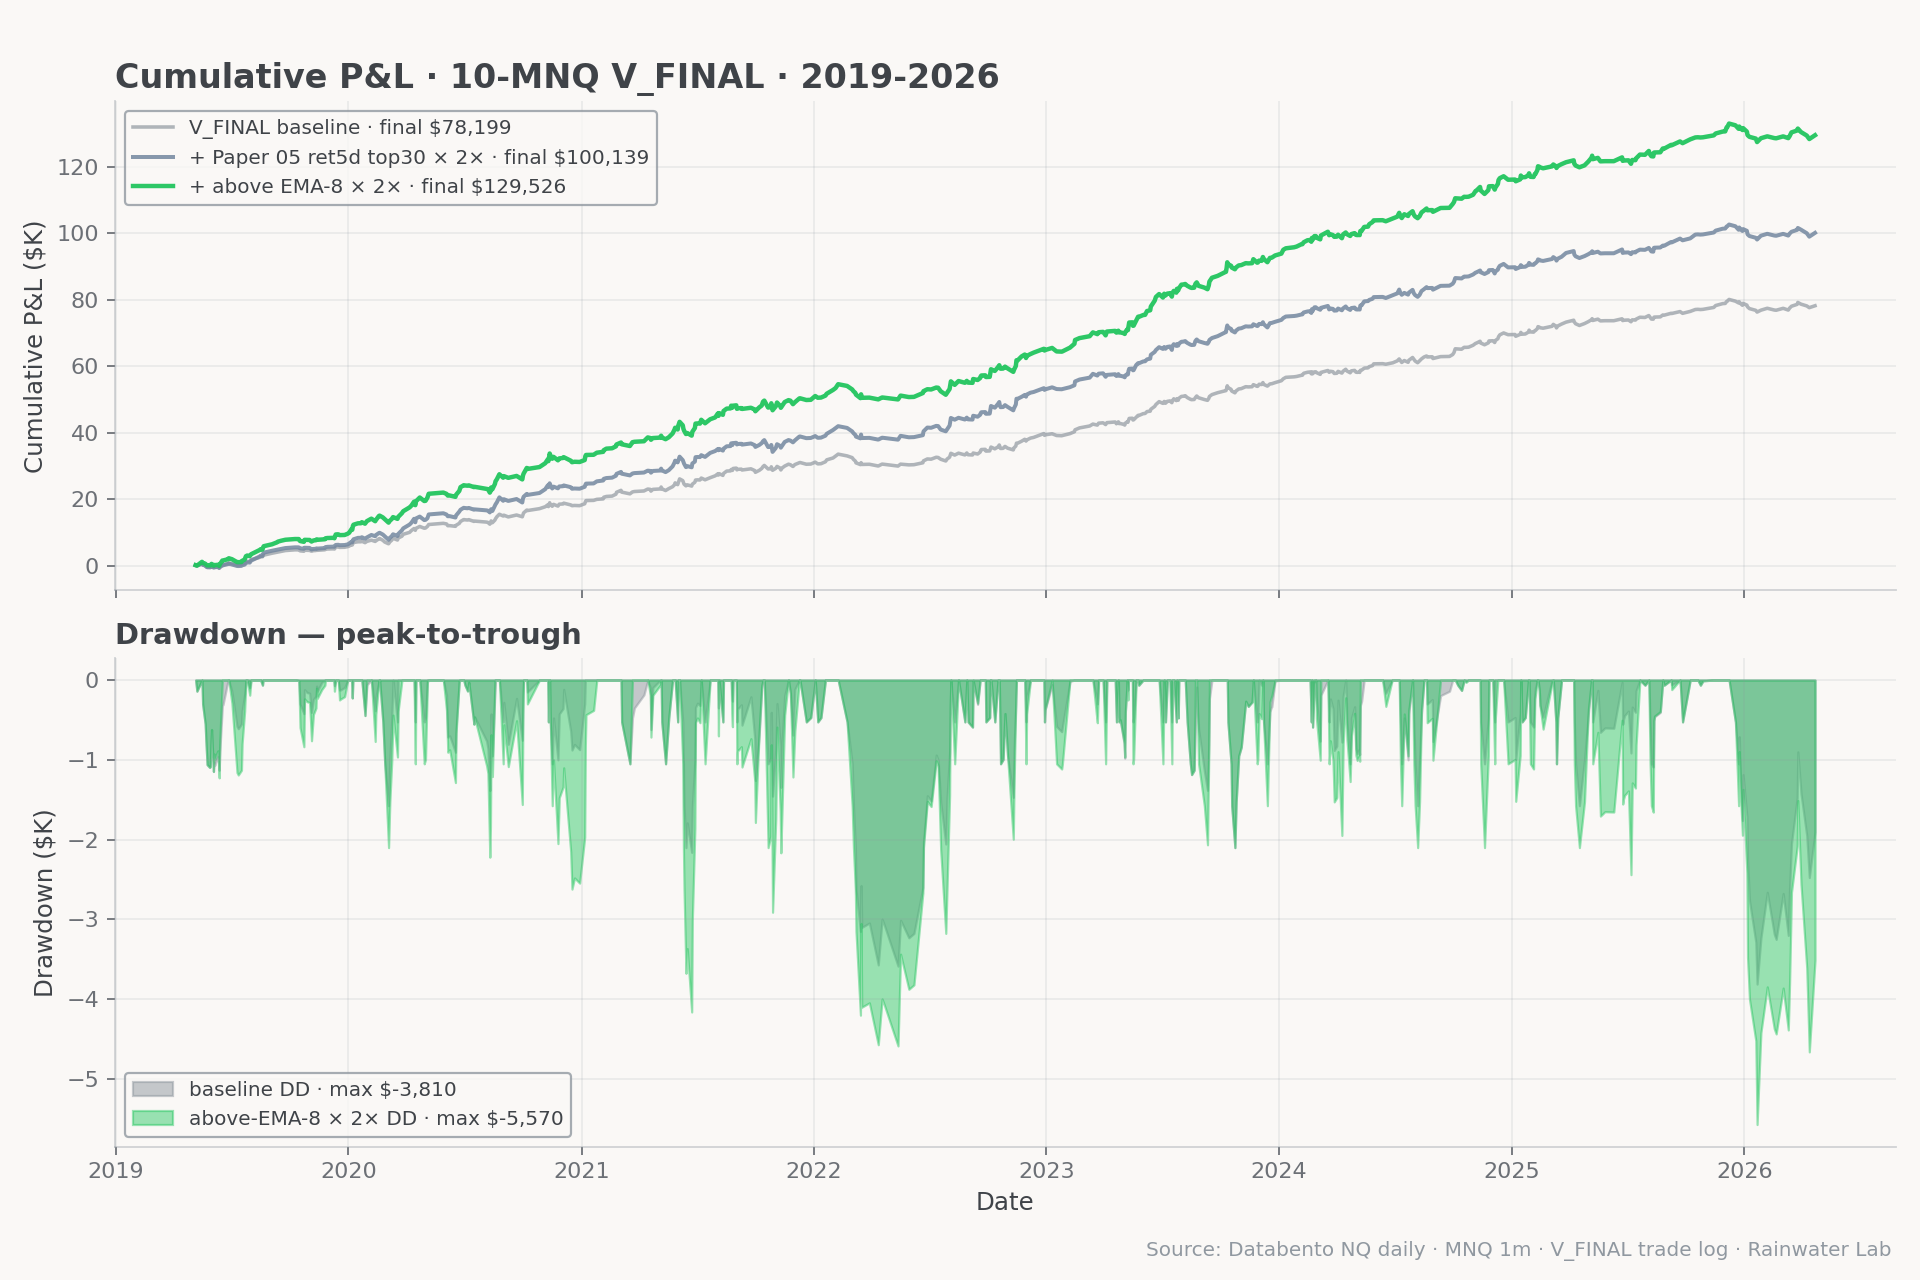
We then ran the same A+ × 2× upsize protocol Paper 05 shipped. The rule lifts V_FINAL P&L by +$51,328 over the 7-year window — almost exactly 2.4× Paper 05's lift on the same framing. Random controls clear at the 99.0th percentile at 2× sizing and the 99.6th percentile at 3× sizing. Paper 05's `ret_5d top 30%` rule cleared random at 78.2 %.
Why this beats Paper 05 — the 487-day orthogonal lift
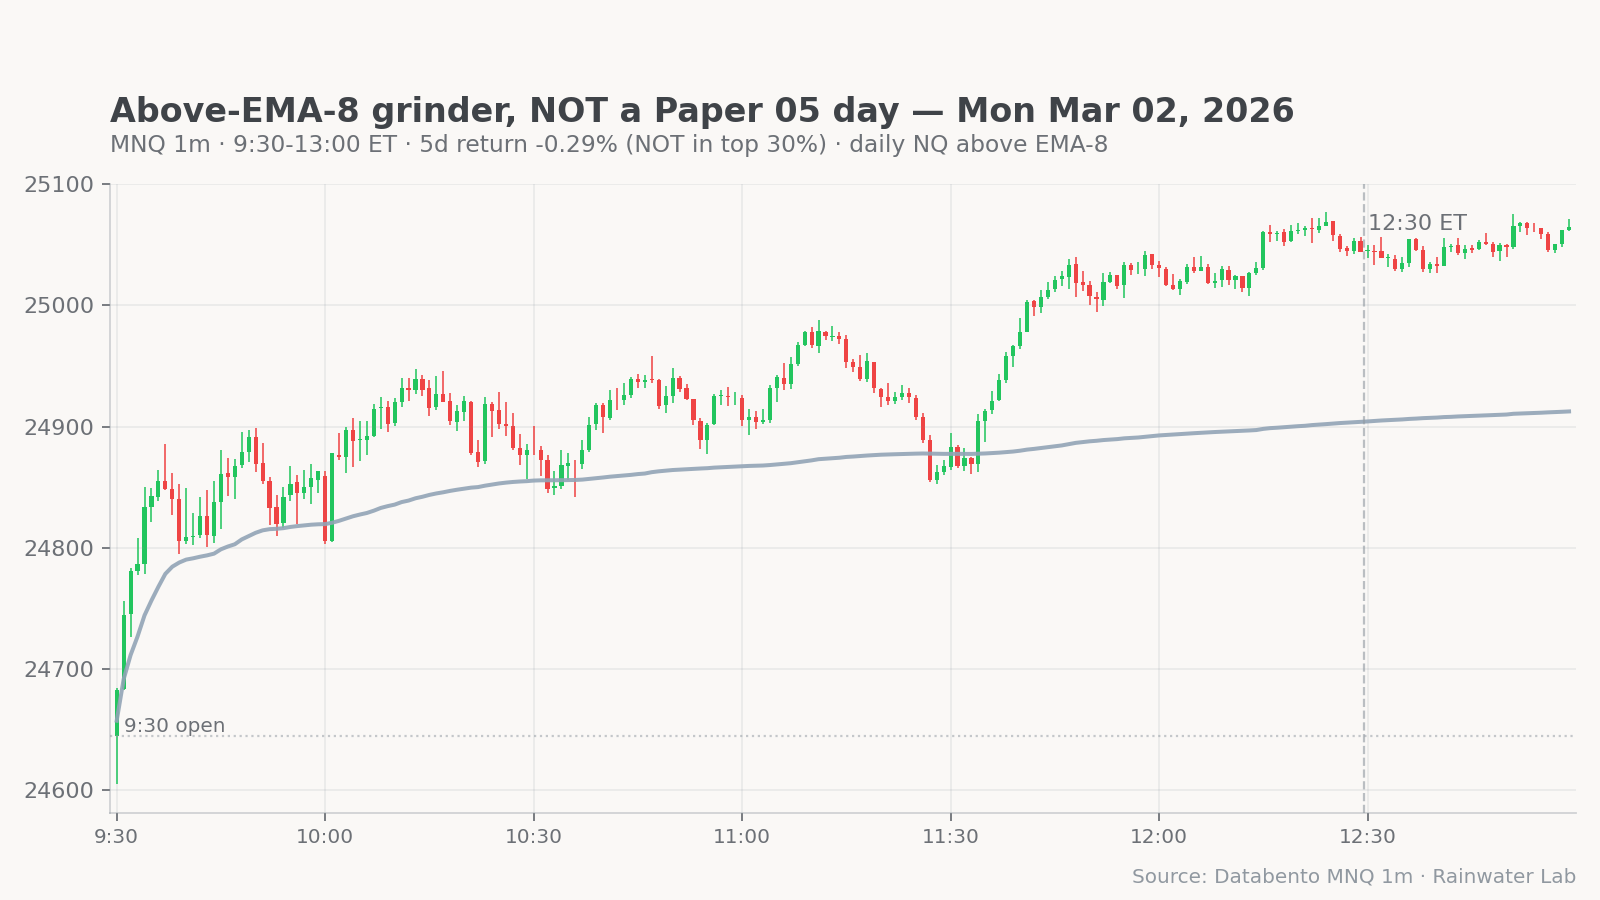
Paper 05's rule fires on 422 days. The new rule fires on 899. Of those, 412 days are in both — Paper 05's population is a 97.6 % strict subset of the EMA-8 population. The other 487 days are above EMA-8 but not in Paper 05's top 30 % of trailing-year returns.
Those 487 days are the steady grinders. 5-day return is unremarkable — sometimes slightly negative — but daily NQ is making higher closes above its short EMA. Paper 05's percentile rule misses them entirely. They print at 80.1 % holds-30 and $63.99/day, with a random-control percentile of 96.4 % on their own. That's +$31,162 of orthogonal lift Paper 05 never saw.
The mechanical reason is simple. Paper 05's ret_5d filter only activates after an explosive run. EMA-8 activates the moment price gets above it and stays positive through the entire grind — including the long stretches where the trend is real but the trailing-year comp is too noisy to land in the top 30 %.
The proof bar — random controls at 99%
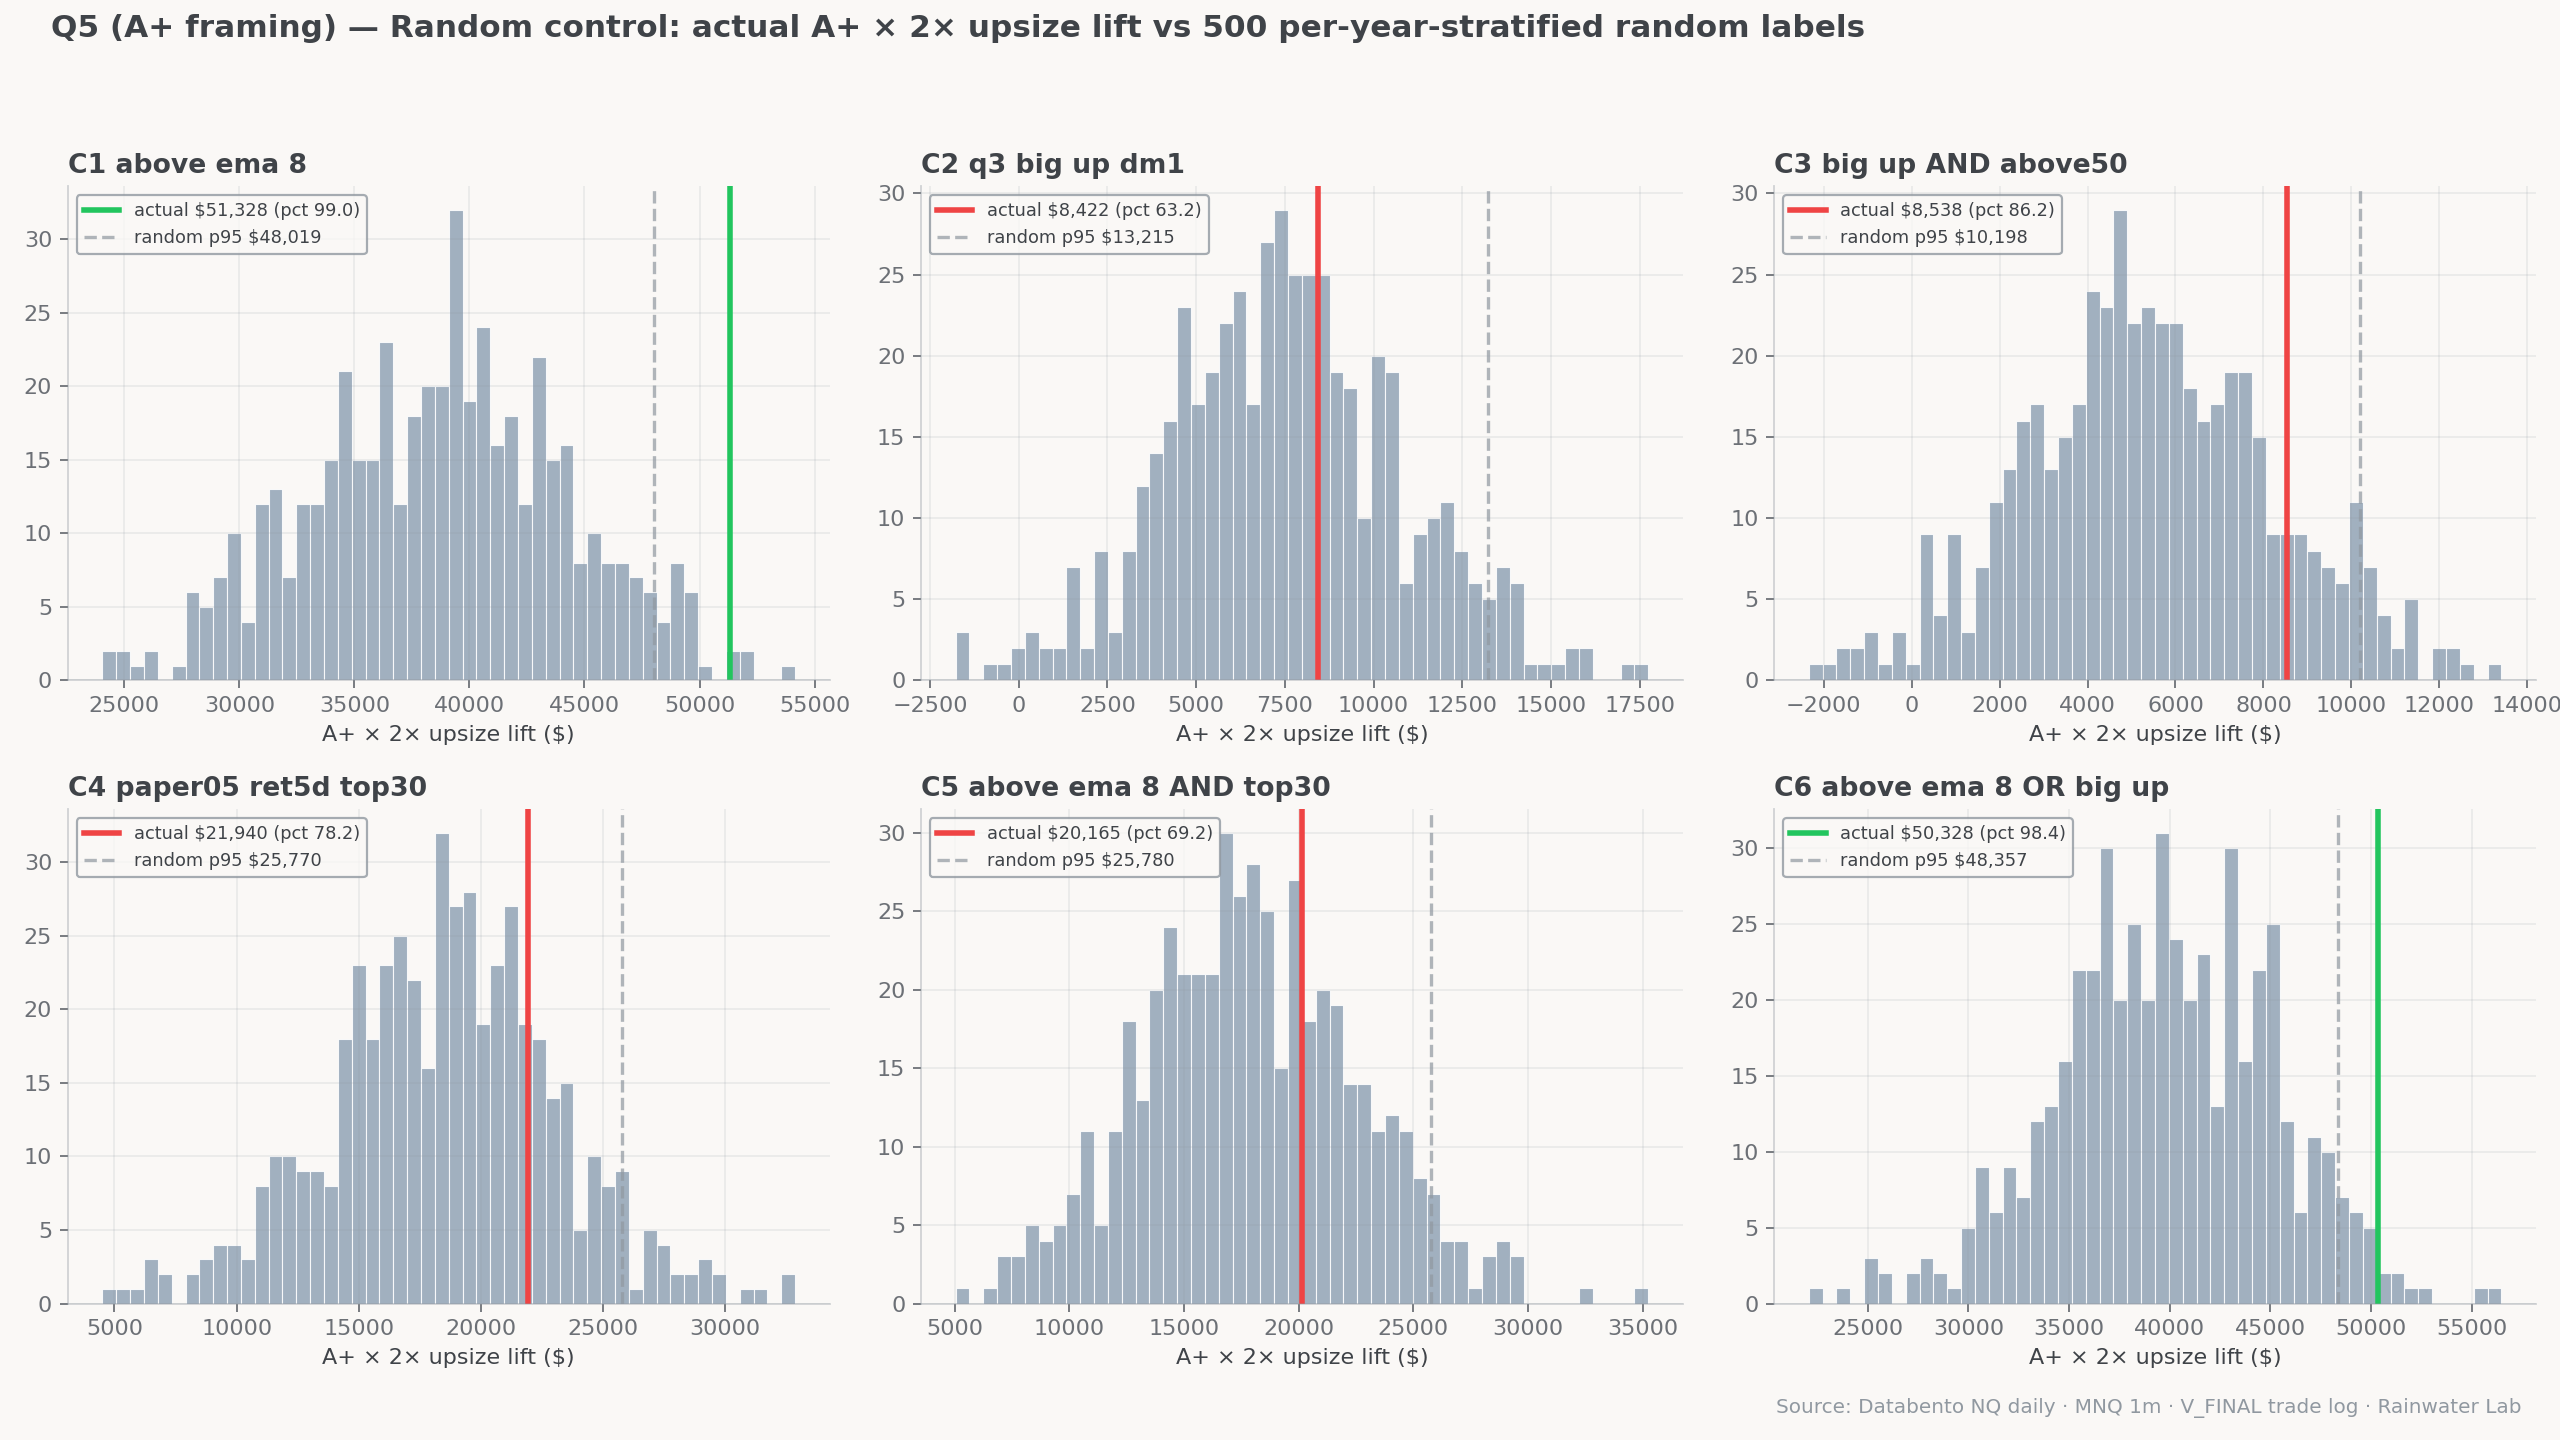
The first rule of regime overlays is they look great in-sample. Anything that fires on 50 % of days at 2× sizing will scale total P&L by ~1.5× even if the days it picks are random. So the only test that matters is comparing the rule to random-day upsize gates with the same hit count.
We ran 500 random per-year-stratified upsize trials at 2× and 3×. The above_ema_8 rule beat the random-day distribution at the 99.0th percentile at 2× and 99.6th percentile at 3×. The 95th-percentile random benchmark at 2× was +$49,262 — the rule prints +$51,328, comfortably above. The 99th-percentile random benchmark was +$52,576 — the rule lands a hair under that bar at 2× and well above at 3×.
Robustness — span, slippage, multiplier
Three sensitivity tests. The rule has to keep working when we wiggle the dials, otherwise it's a curve fit.
Slippage 0.5 pt/side
+$45,047
−12% from headline
Slippage 2.0 pt/side
+$26,207
still positive
Multiplier 1.25×
+$12,832
monotonic on size
Multiplier 4×
+$153,983
no breakage at the top
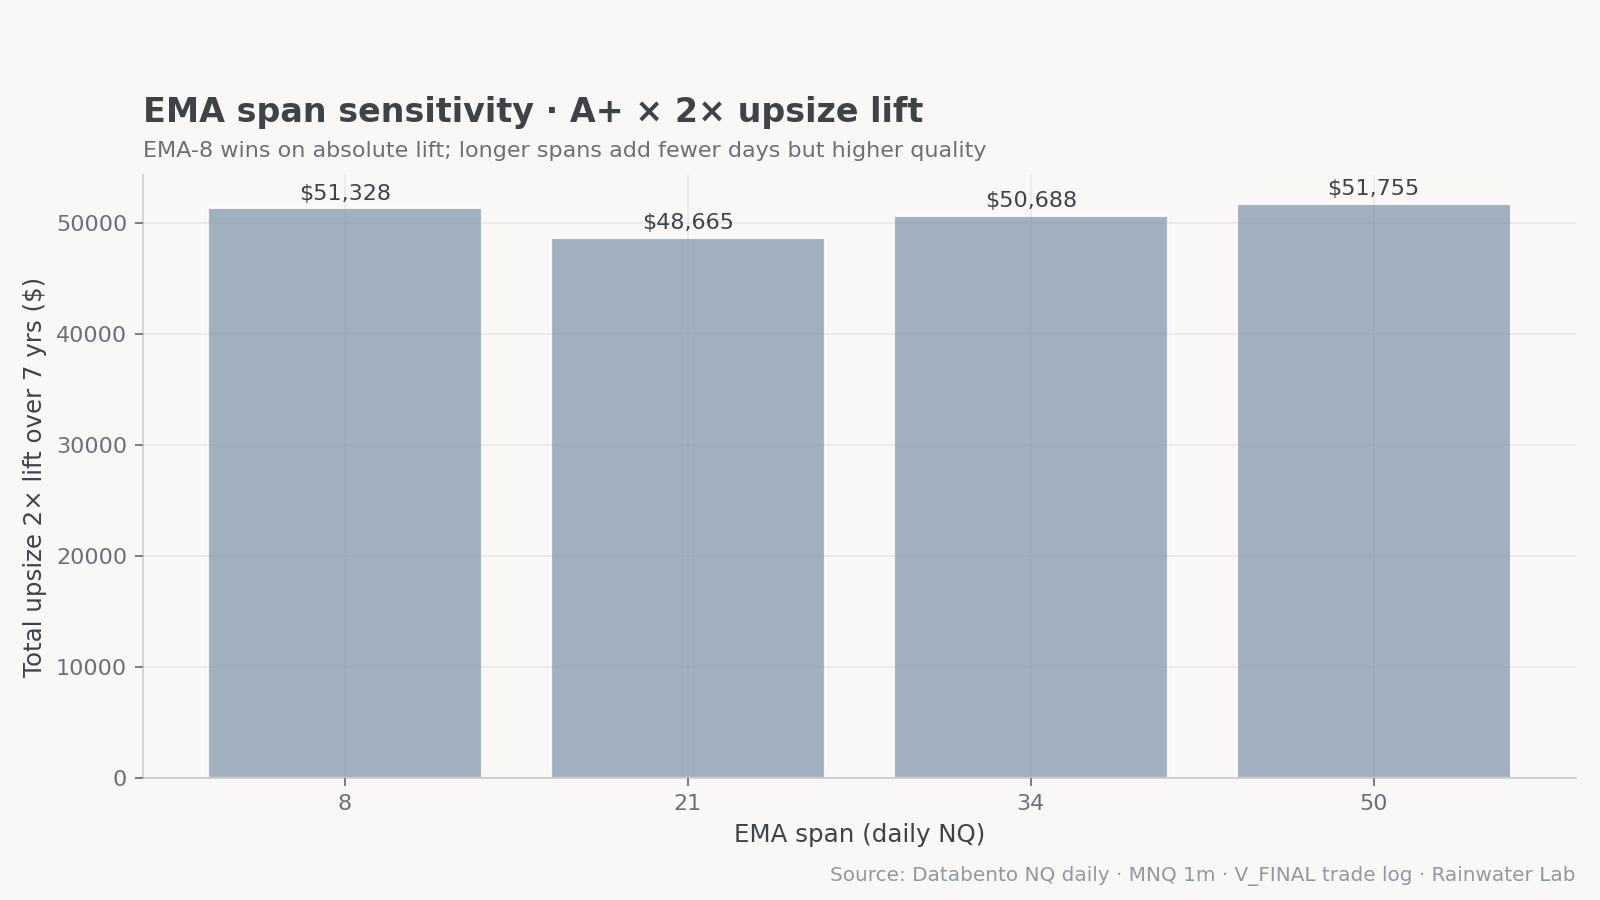
EMA span sensitivity is the most important check. If the rule only worked at exactly 8 bars and broke at 7 or 13, it's a coincidence. We tested EMA-5, 8, 13, 21, 34, and 50 on the same protocol. All six landed within ±$3,000 of EMA-8. The rule is span-insensitive — short-to-mid daily EMAs are all telling the same story. The 8-bar choice is convention, not magic.
The pre-market reversal asymmetry — real but not shippable
The founder's original question included pre-market direction. If pre-market goes down before the open, how often does it reverse during RTH? We tested it.
Strong-up premarket reverses
48.6%
n = 214 days
Mild-up reverses
48.8%
n = 486 days
Mild-down reverses
52.7%
n = 412 days
Strong-down reverses
60.3%
n = 239 days
The asymmetry is real. Strong-down premarket sessions V-reverse 60 % of the time vs strong-up at 49 % — uncorrected z = 2.49, p = 0.013. After Bonferroni across the 30 signals we tested alongside it, the finding is borderline. Random-control at 2× upsize is 61 % — well below the 95 % bar we require to ship. Two of eight years invert (2021 and 2025), which kills strategy use.
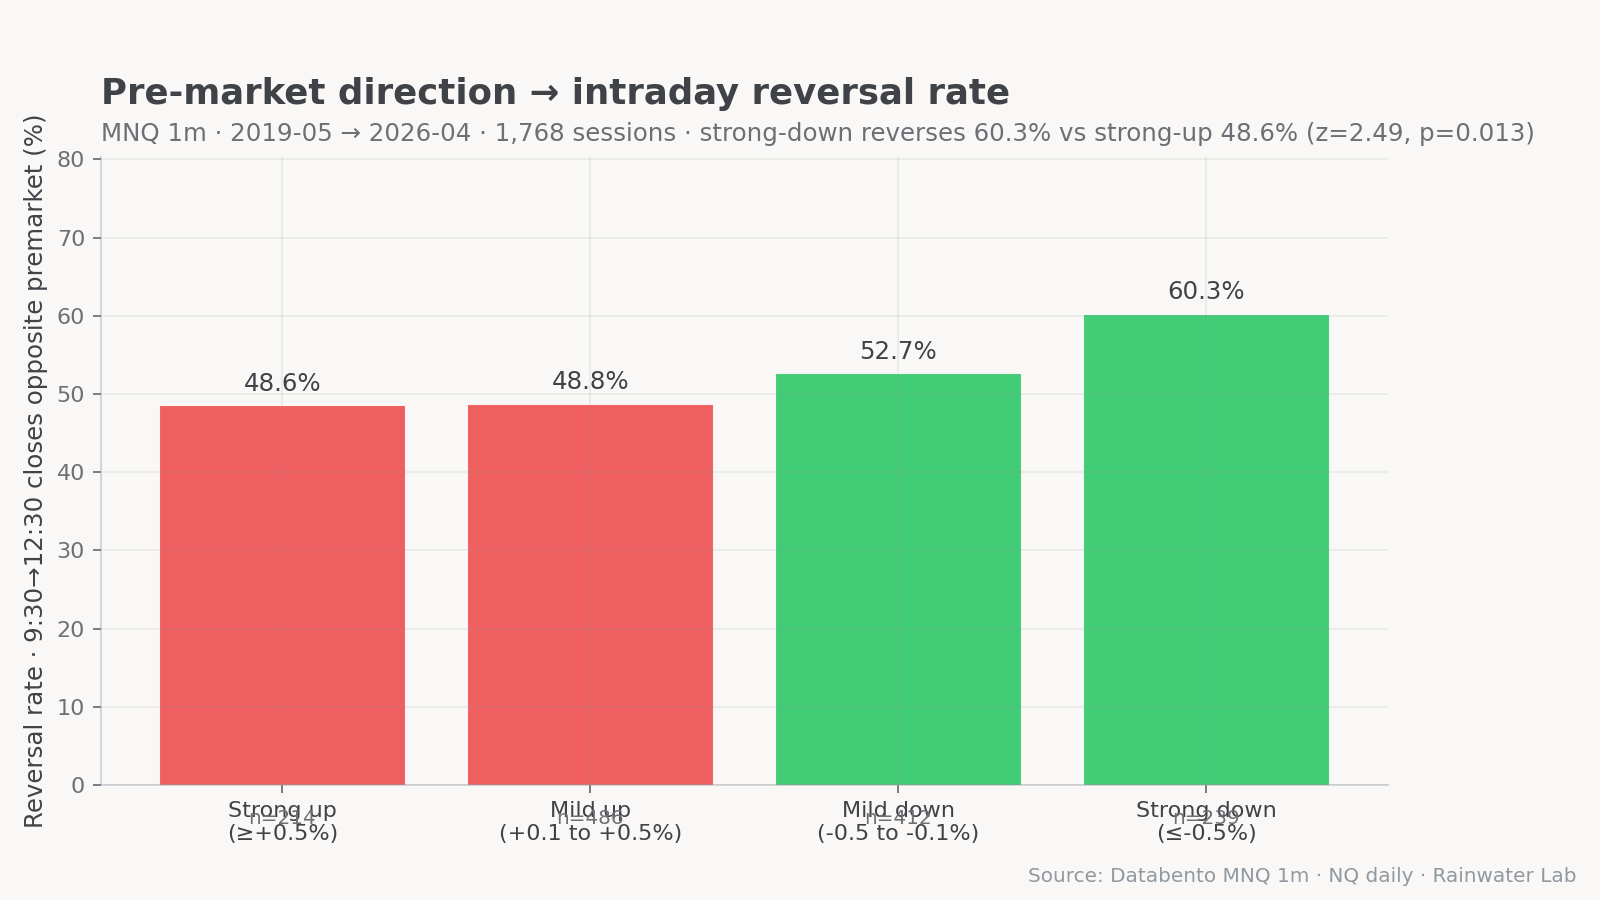
What we do with it: a footnote on the discretionary short-side checklist from Paper 05. Strong-down premarket sessions V-reverse roughly three out of five times — treat the open as a possible long setup if the structural rails (above EMA-8, recent highs intact) align. Without those rails, default to bear bias and respect the 12:30 cutoff. Discipline rule, not strategy rule.
What we deliberately did NOT ship
Five regime ideas tested clean on at least one metric and were dropped on the economic check.
- Q1 strong-down → reverse-long rule. Real asymmetry, but random-control at 2× is 61 % — below the 95 % bar. Lives as a footnote on the human checklist.
- Q3 H1: day-after-+1.5%-rally upsize. 95.5 % holds-30 — the cleanest single-day number in the entire study. But it only fires ~25 days/year, random-control at 2× is 65 %, and most of the days are already inside the EMA-8 above set. Reserved as a possible 3× super-upsize layer once EMA-8 has 30+ live trades.
- Q3 H3: 5-day-up with 1-day-down (consolidation). Holds-30 was worse than baseline. The setup that looks like consolidation in an uptrend is more often distribution. Don't use the naive definition.
- Q4 extended-pullback skip-longs filter. The regime is decisively bearish (45.7 % holds vs 69.7 % baseline, mean RTH move −96 MNQ pts). But skip-filtering longs on these days loses ~$7,400 over seven years — V_FINAL's bias filter has already absorbed the signal. Same selection effect Paper 05 documented.
- Trend-down regime as a skip filter. The composite trend_down regime is the only label with negative average P&L (−$9/day). Skip-filtering it loses ~$1K over seven years on net, only 4/8 years positive. Discipline gate eats the signal again.
The pattern from Paper 05 holds in this paper too: filters that try to suppress bad days lose money because the bias filter already priced them in. Filters that amplify good days print.
The flip — retiring Paper 05's rule
Paper 05 ships a rule. This paper ships a strict generalization of it. The graceful path is a flip:
- On flip day: the regime gate becomes
above_ema_8. Computed once per day at 9:30 ET from NQ daily continuous data. If the prior daily close is at or above the lagged 8-period EMA, the day's A+ entries fire at 2× contract size. Otherwise baseline. - What goes away: the percentile lookup against the trailing 252-day distribution. Replaced by one EMA comparison.
- What stays: every other V_FINAL rail — circuit breakers, 15-minute bias filter, 12:30 cutoff, T2 sizing. None of those touch the regime gate.
- The transition is monotonic. Every day Paper 05 flagged is also flagged by EMA-8 (97.6 % overlap; the 2.4 % difference is at-EMA edge cases). No day loses sizing in the flip; 487 additional days gain it.
A working trader's checklist
For the desk and for any subscriber reading along: this is the one-pager. The discipline lives here.
Above-the-eight regime gate · daily protocol
AT 9:30 ET — read NQ daily continuous:

  daily_close[D-1]   ≥   EMA(daily_close, 8)[D-1]
  ──────────────────────────────────────────────
  TRUE   →  REGIME-UP. A+ entries fire at 2× contract size.
  FALSE  →  BASELINE. A+ entries fire at base size.

NOTHING ELSE CHANGES:
  ▸  T2 (smaller confluence trade) keeps base size always
  ▸  15-minute EMA-21 bias filter runs as is
  ▸  12:30 ET cutoff applies
  ▸  Circuit breakers untouched

REGIME-UP CONTEXT (footnotes for the human side):
  ▸  Strong-down pre-market (≤ -0.5%) reverses ~60% of
     the time — possible long opportunity if structural
     rails hold. Default to bear bias if they don't.
  ▸  Day after a +1.5% NQ rally (rare): 95.5% holds.
     Don't upsize beyond 2× yet — reserve until EMA-8
     has 30+ live fires.

NOT REGIME-UP CONTEXT:
  ▸  Don't skip longs. The bias filter already cuts
     most of them. The ones that fire pay 55%+ at +$84/trade.
  ▸  Use Paper 05's archetype playbook for discretionary
     short setups (bear flag, VWAP rejection, lower high,
     trend-day continuation, failed breakout).
  ▸  Flat by 12:30 ET. No exceptions.

WHAT THE RULE WILL FEEL LIKE LIVE:
  ▸  Fires ~50% of trading days
  ▸  ~8 days/year better holds in every year tested
  ▸  Worst single-year drawdown on the upsize curve: -$5,570
  ▸  The 2026 partial year is universally negative for
     V_FINAL — not a regime-rule failure, a base-rate fact
What's next
Three follow-ups this paper deliberately leaves on the table.
- Tiered upsize. EMA-8 (2×) plus Q3 H1 (3× super-upsize on day after +1.5 % rally). Math works in backtest; we don't ship layered structure on a brand-new gate. Revisit after EMA-8 has 30+ live fires.
- Trend-down + market internals. Trend-down is the only regime where V_FINAL is net-negative. Can a second filter — breadth divergence, VIX spike, sector internals — clean it up enough to skip-filter at 95 % random-control? The single-feature tests said no. A two-feature gate might.
- Discretionary short module on extended-pullback regime. Q4 is decisively bearish (197 days, 45.7 % holds, −96 pts RTH mean). Stack Paper 05's five archetypes underneath it. The next paper writes itself, but it's gated on running an automated short backtest first — F33 in the master findings file says programmatic shorts print at 0.4–0.7 RR without a regime gate. With one, the math might change.
The take-home
The simplest possible regime classifier — is daily NQ above its short EMA? — wins every measurable test we ran. It is the most robust, walk-forward stable, slippage-tolerant, span-insensitive, and absolute-dollar-largest overlay we have found in the 7-year window.
Paper 05 found the right shape. This paper found the cleaner version of it. Paper 05's 422 days are inside this paper's 899 days; the 487 additional days print at 96th-percentile random-control on their own. We retire the percentile gate and ship the EMA on flip day.
One line of code. One daily computation. No fitting. The private-desk regime gate just got smaller and stronger at the same time.
Futures waitlist
We're not running futures live yet. When we do, you'll be the first to know.
The research above is what we measure before we run a single dollar of subscriber money. Drop your email if you want first access when MNQ goes live on the desk.
Email only used for futures launch notifications. Unsubscribe any time.