Paper 02 · 6 min read · April 28, 2026
MNQ vs MES, per dollar of risk.
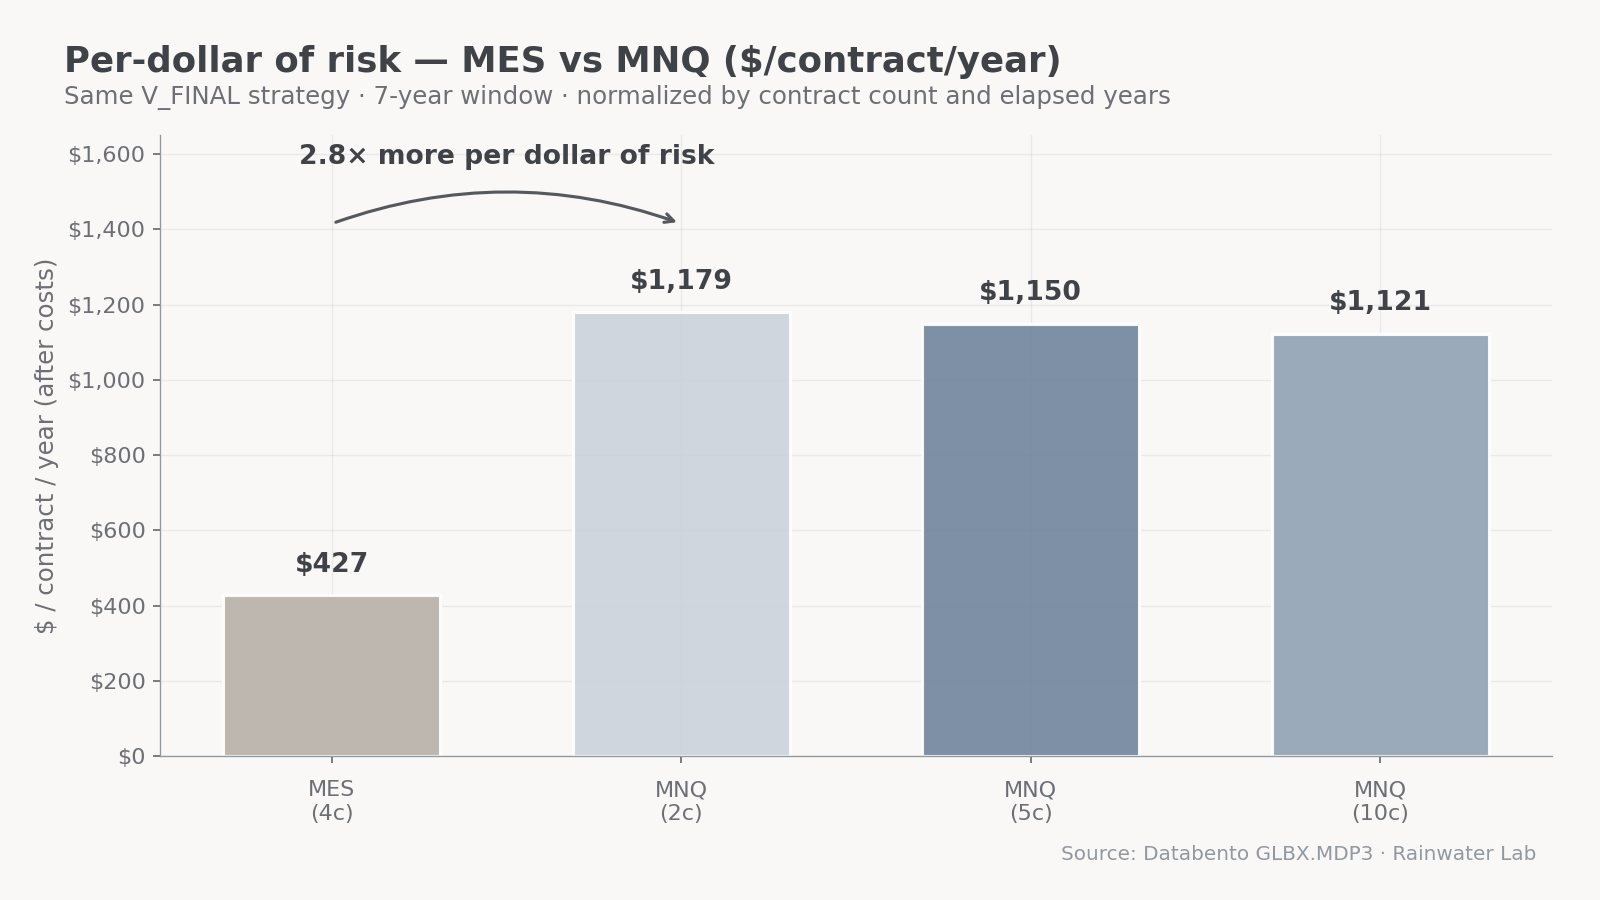
Same strategy. Same data. Two contracts. One delivers $1,118 per contract per year. The other delivers $425. We picked the smaller one — here's why.
MNQ edge
$1,118 / yr
MES edge
$425 / yr
Win rate
64% (both)
Profit factor
1.93 (both)
The question
Same strategy, same window, same rules. Run it on MES (Micro E-mini S&P 500) and run it on MNQ (Micro E-mini Nasdaq). Which one pays better per dollar at risk?
The instinct says MES — bigger underlying, more liquidity, lower spread. The data says the opposite, and the gap is wider than we expected.
The contracts
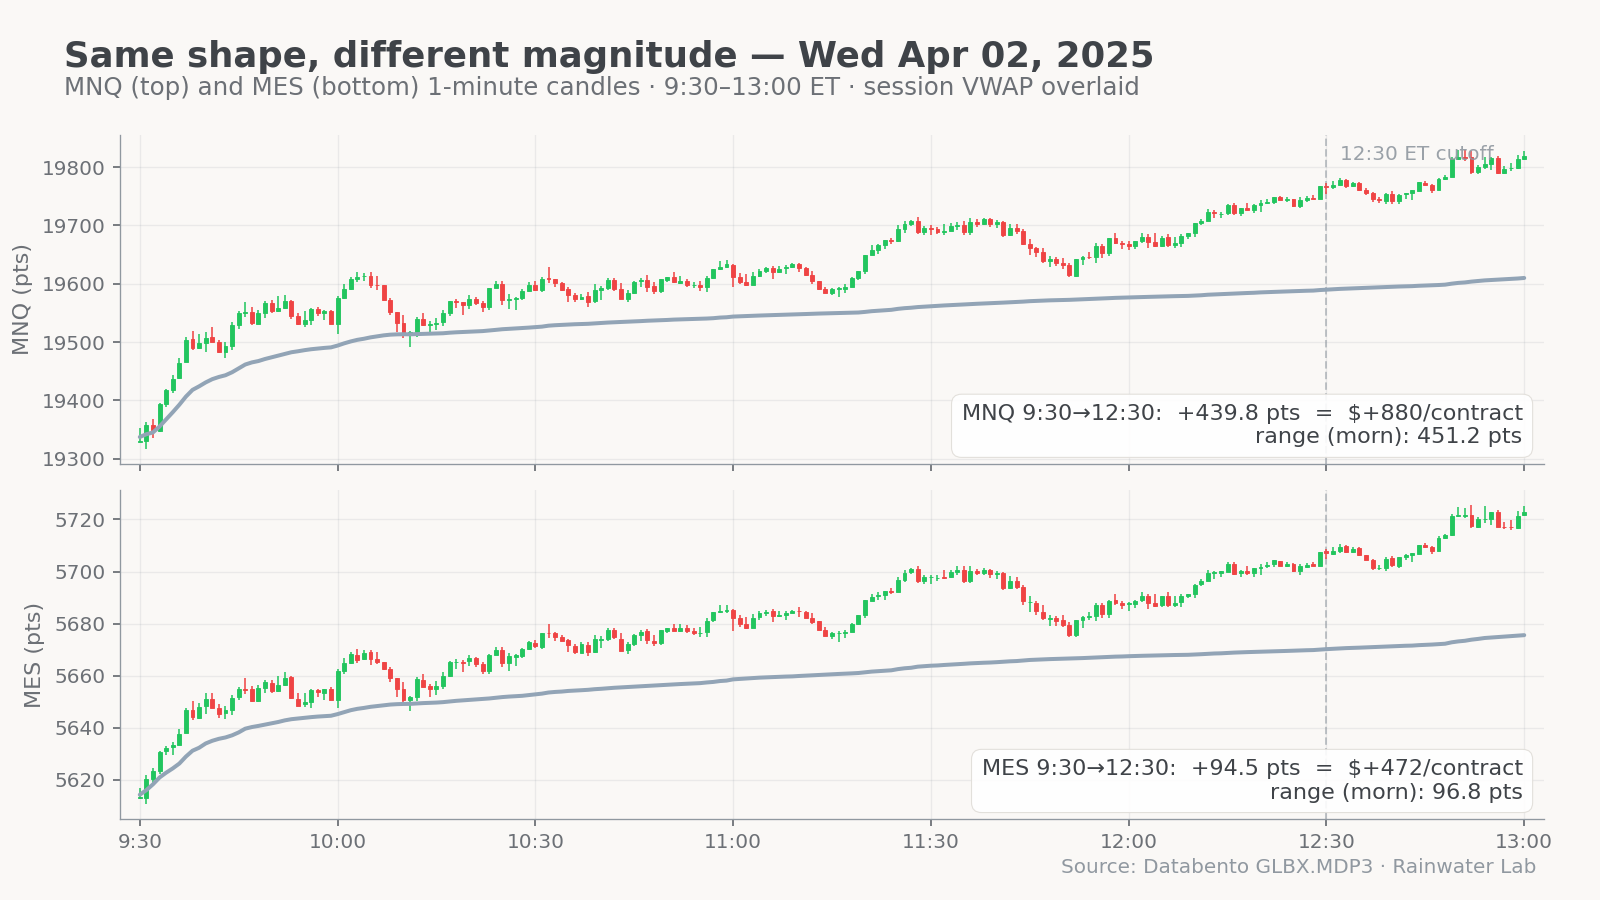
Both are micro futures. Both clear through the same exchange. The math that separates them comes down to point value and how much an average move is worth.
- MES — point value $5. A four-point move (a typical small target) is $20 per contract. Tick size is 0.25 pts ($1.25/tick).
- MNQ — point value $2. But the Nasdaq's average minute range is roughly five times the S&P's, so a comparable move is more like 20–30 points — $40 to $60 per contract. Tick size is 0.25 pts ($0.50/tick).
Read that twice. MNQ's point value is smaller, but the moves are bigger. What matters is per-dollar-of-risk return, not nominal point value.
The backtest
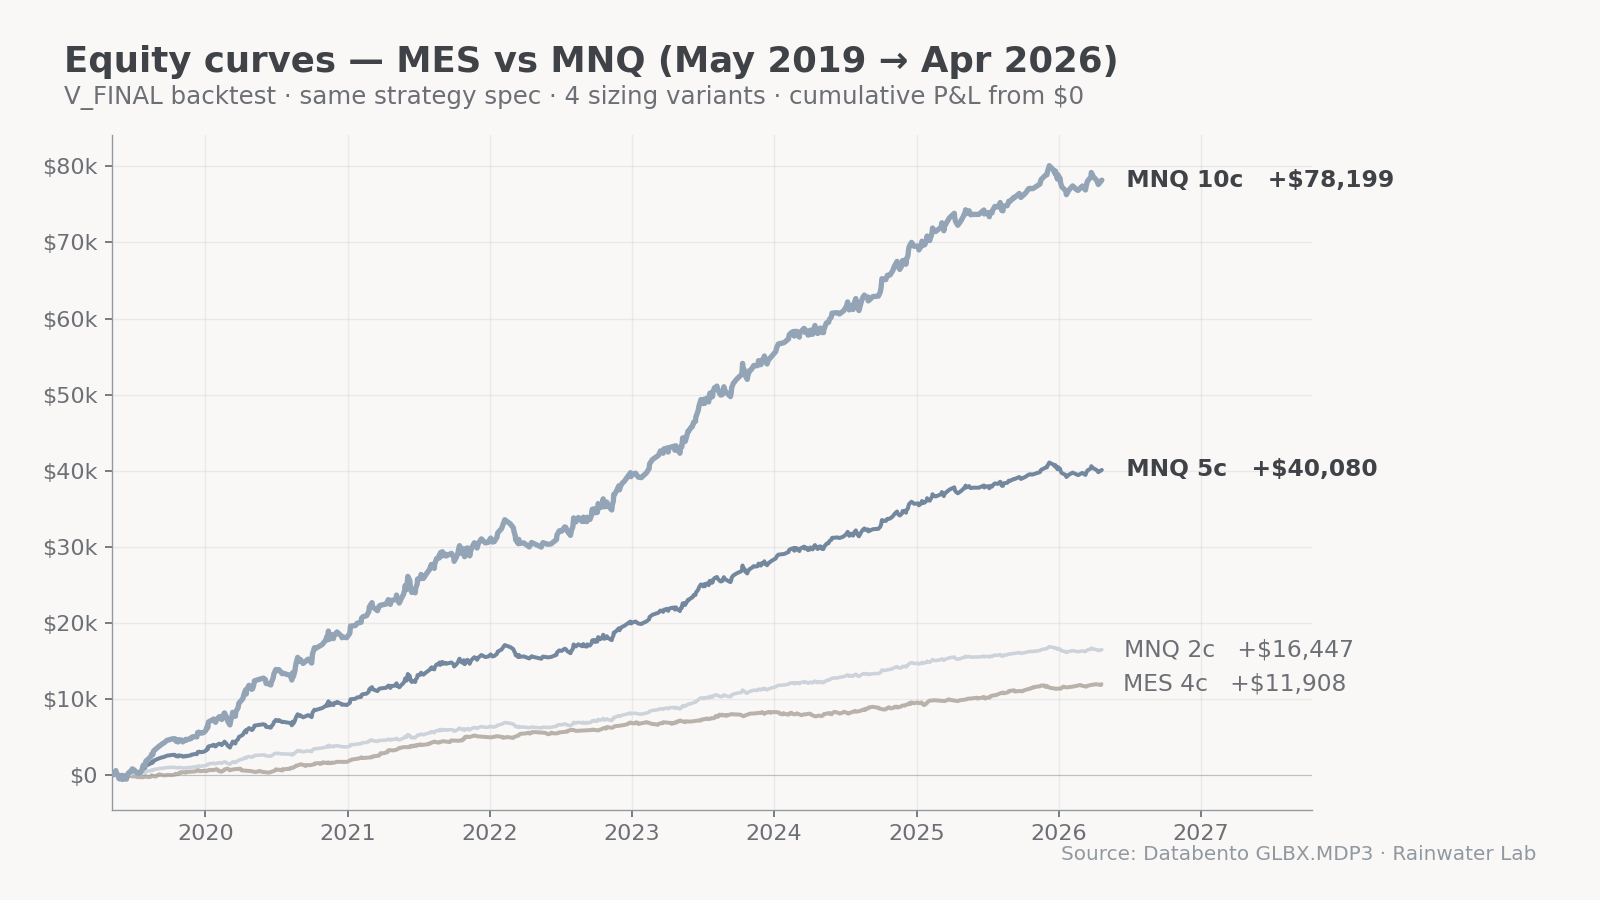
Seven years of front-month continuous data, the full V_FINAL strategy spec — A+ tier sniper trades plus the T2 confluence workhorse, with daily circuit breakers, the 12:30 PM hard cut, and the day-of-week filters all on. Slippage modeled at 0.5 pts round-trip. Commissions accurate to TradeStation's 2026 rates ($1.50/MES, $0.50/MNQ round-trip).
Account $25K
$2,350 / yr
MNQ at 2 contracts A+
Account $50K
$5,725 / yr
MNQ at 5 contracts A+
Account $50K+
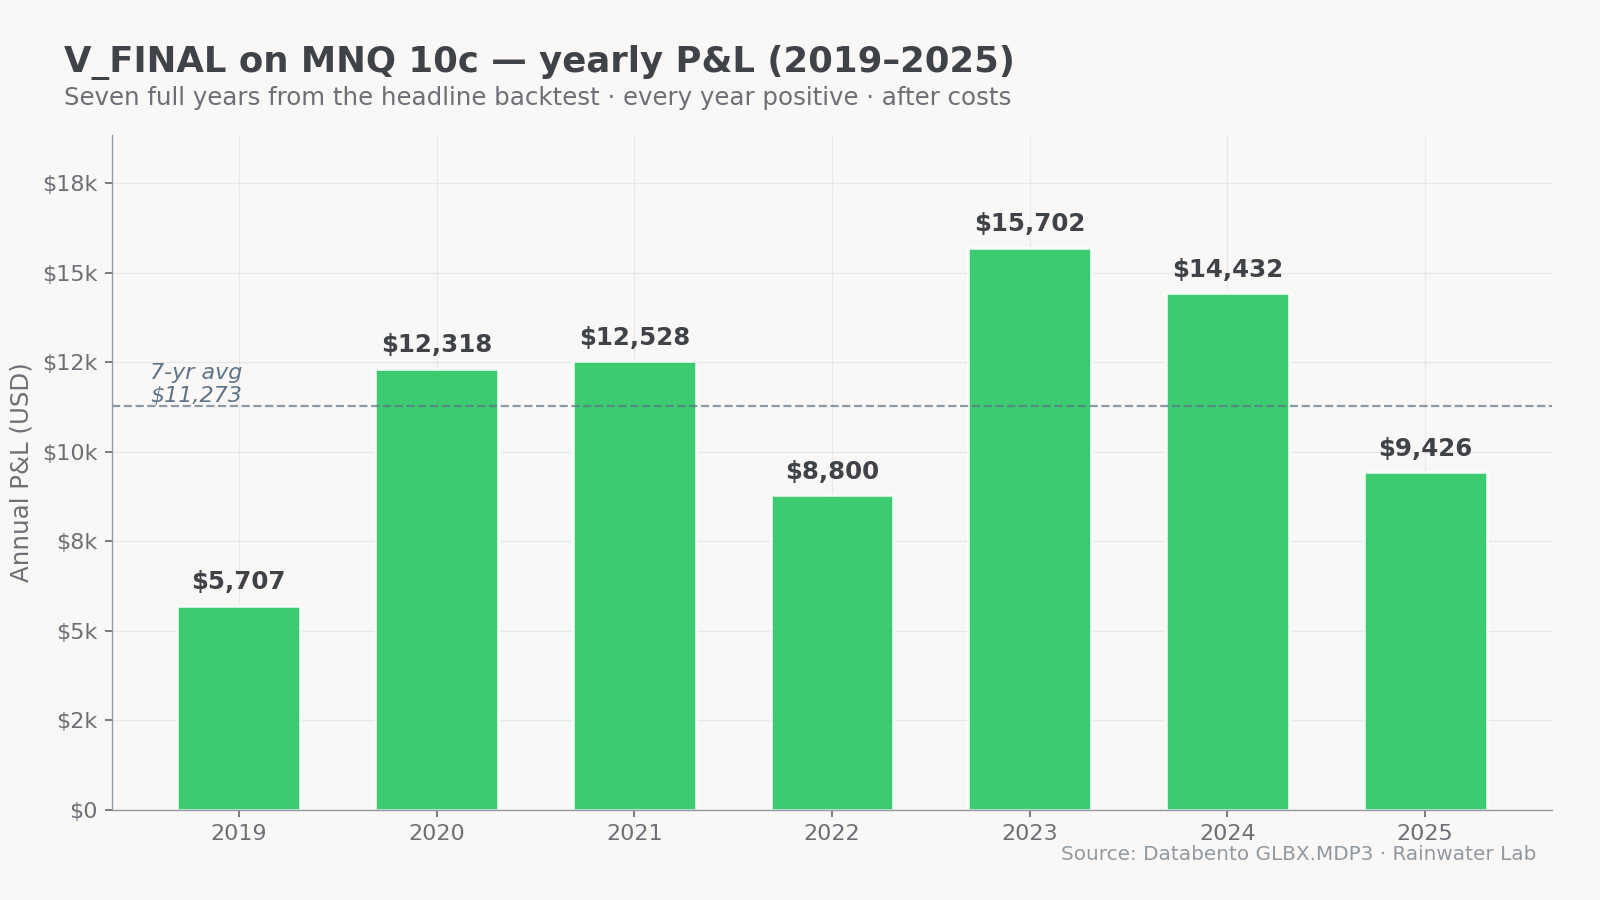
$11,170 / yr
MNQ at 10 contracts A+
Same on MES
$425 / contract
Per year, after costs
That's a clean 2.6× ratio per dollar of risk. The MNQ contract delivers more dollar P&L per dollar at risk than the MES contract — even though MES feels safer because the point value is smaller.
Why the gap exists
Two reasons. First, the average true range on MNQ is meaningfully wider than on MES, which means the same fixed-point stop is a smaller fraction of typical noise on MNQ — you get stopped out less. Second, the same target threshold (in points) on MNQ translates to more dollars per contract per win, because the noise that the win has to beat is denominated in the same wider moves.
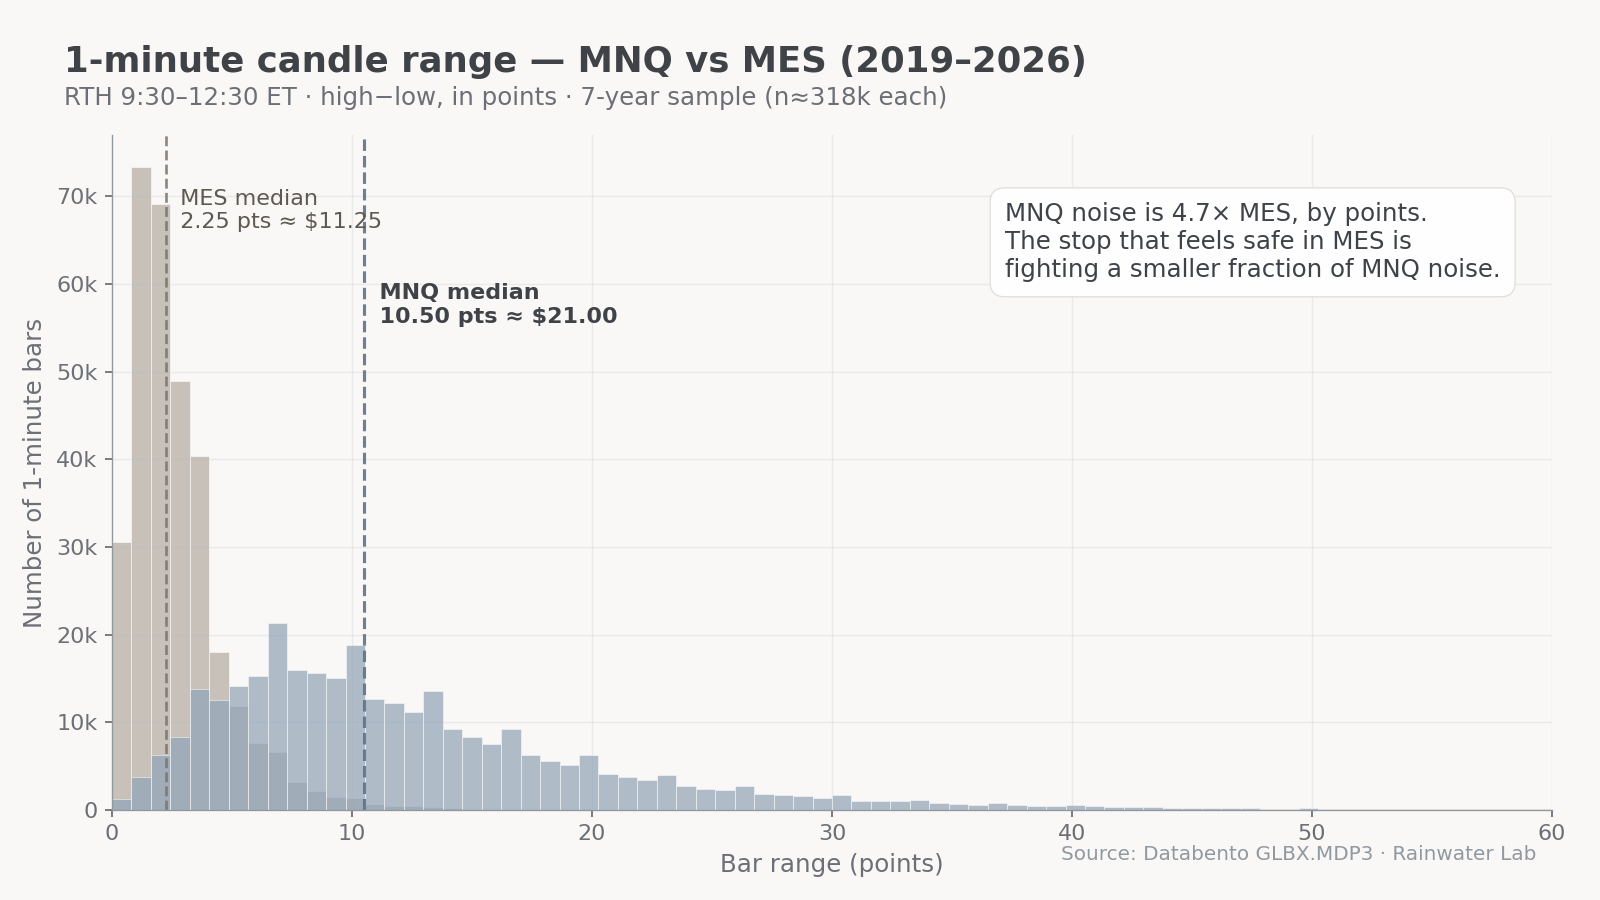
MES feels safer because a 4-point stop is “only $20.” But $20 is a larger fraction of a typical MES candle than $50 is of a typical MNQ candle. Risk isn't measured in dollars. It's measured in noise.
What we picked, and what it means
The desk runs MNQ-first. MES is included in the framework — anyone with a smaller account or who already has an open MES contract can run the same strategy on it — but we wouldn't recommend it as the primary instrument. The math doesn't favor it.
One important caveat: the same strategy run on both contracts simultaneously is a mistake we don't make. Nasdaq and S&P 500 futures are roughly 95% correlated intraday — running the strategy on both at the same time is a sizing trap, not a diversification benefit. Pick one per session.
Futures waitlist
We're not running futures live yet. When we do, you'll be the first to know.
The research above is what we measure before we run a single dollar of subscriber money. Drop your email if you want first access when MNQ goes live on the desk.
Email only used for futures launch notifications. Unsubscribe any time.