Paper 07 · 14 min read · May 6, 2026
More trades was the wrong goal.
V_FINAL is quiet. It sits flat on most trading days. We tested three ways to fix that — by taking the chart's blue triangles, by holding longer, or by mining the days the desk doesn't show up. Two of the three said V_FINAL was already right. The third gave us a conservative +$40,531 one-contract stack, +$79,932 at a hard two-contract cap, and 57.9% active-day coverage without watering down what makes the desk work.
1x stack
+$40,531
2x cap stack
+$79,932
Active-day coverage
57.9%
Positive partial years
8 of 8
The desk problem
This is the contract-normalized version of the internal futures stack. The larger research book has live-style sizing baked into it. For deployment decisions, the cleaner question is smaller: what did one MNQ contract do, and what did a hard two-contract cap do, over the same seven-year tape?
At the conservative 1x cap, V_FINAL contributes $8,788.25. STRAT04, the Q4 opening-drive short module, adds $5,940.50. The four-rule quality layer adds $25,802.00. Together, the book finishes at $40,530.75 on one contract, or $79,932.00 under the hard two-contract cap.
The trade-frequency problem is still real. V_FINAL alone fires on about 34.8 % of sessions. Add STRAT04 and coverage rises to 38.1 %. Add the quality stack and the desk reaches 57.9 % active-day coverage without taking the noisy trades that made the broader miner look busy.
The founder asked the obvious question — for a month, on most days, while staring at indicator triangles printing at every confluence touch: are we leaving money on the table?
We tested three answers. Two of them came back saying V_FINAL was right. The third said yes, but smaller than we wanted, and only after we threw away the obvious version of the rule.
The three tests
Each test attacked a different surface where V_FINAL might be too tight: the entry, the exit, and the universe of trade-days.
- The entry test. Our chart indicator paints a blue triangle whenever 2 or 3 detectors fire simultaneously. V_FINAL only takes the 3+ confluence cohort. The skipped 2-detector fires paint all day on trend-up sessions. Are they real money we're leaving on the table?
- The exit test. V_FINAL closes A+ trades at fixed +6 to +12 MNQ-pt targets. On strong trend-up days, that target hits and price keeps running another 100+ pts. Could a regime-gated EOD trail recover that giveaway?
- The frequency test. 65 % of days V_FINAL is flat. Mine those idle sessions for any layer that adds trades without diluting the desk's average-trade quality.
For each one we used the same shipping bar Papers 05 and 06 set: walk-forward stable per year, 95th-percentile random control on the same gate set, no curve-fit, no creative reinterpretation.
Test 1 — the chart triangles. V_FINAL was right.
Skipped triangles in 7yr
3,849
n_active = 2 fires V_FINAL passes on
Win rate if you took them all
49.5%
coin flip
Avg per-trade
−$4.28
after slip + commission
Total P&L (1c)
−$16,478
≈ −$2,350/year
We replayed every blue triangle the indicator painted across seven years of MNQ 1-min bars. Four buckets:
- n_active = 2 (the cohort V_FINAL skips): 3,849 fires, 49.5 % win rate, −$16,478
- n_active = 3 (V_FINAL's actual T2 universe): 76 fires, −$81 (raw indicator only — production V_FINAL has additional gates that lift this to +$2,039)
- None of the 15 possible 2-detector pair combinations cleared the pre-random-control threshold. No "vwap reclaim + bull flag" or any other pair printed enough to even try the 95 % bar.
The chart triangles you see all day on trend-up sessions are mostly noise. The indicator is showing you confluence forming. It is not telling you to take every one. The 3+ confluence gate is the empirical boundary between random and real, and V_FINAL parks itself there for a reason.
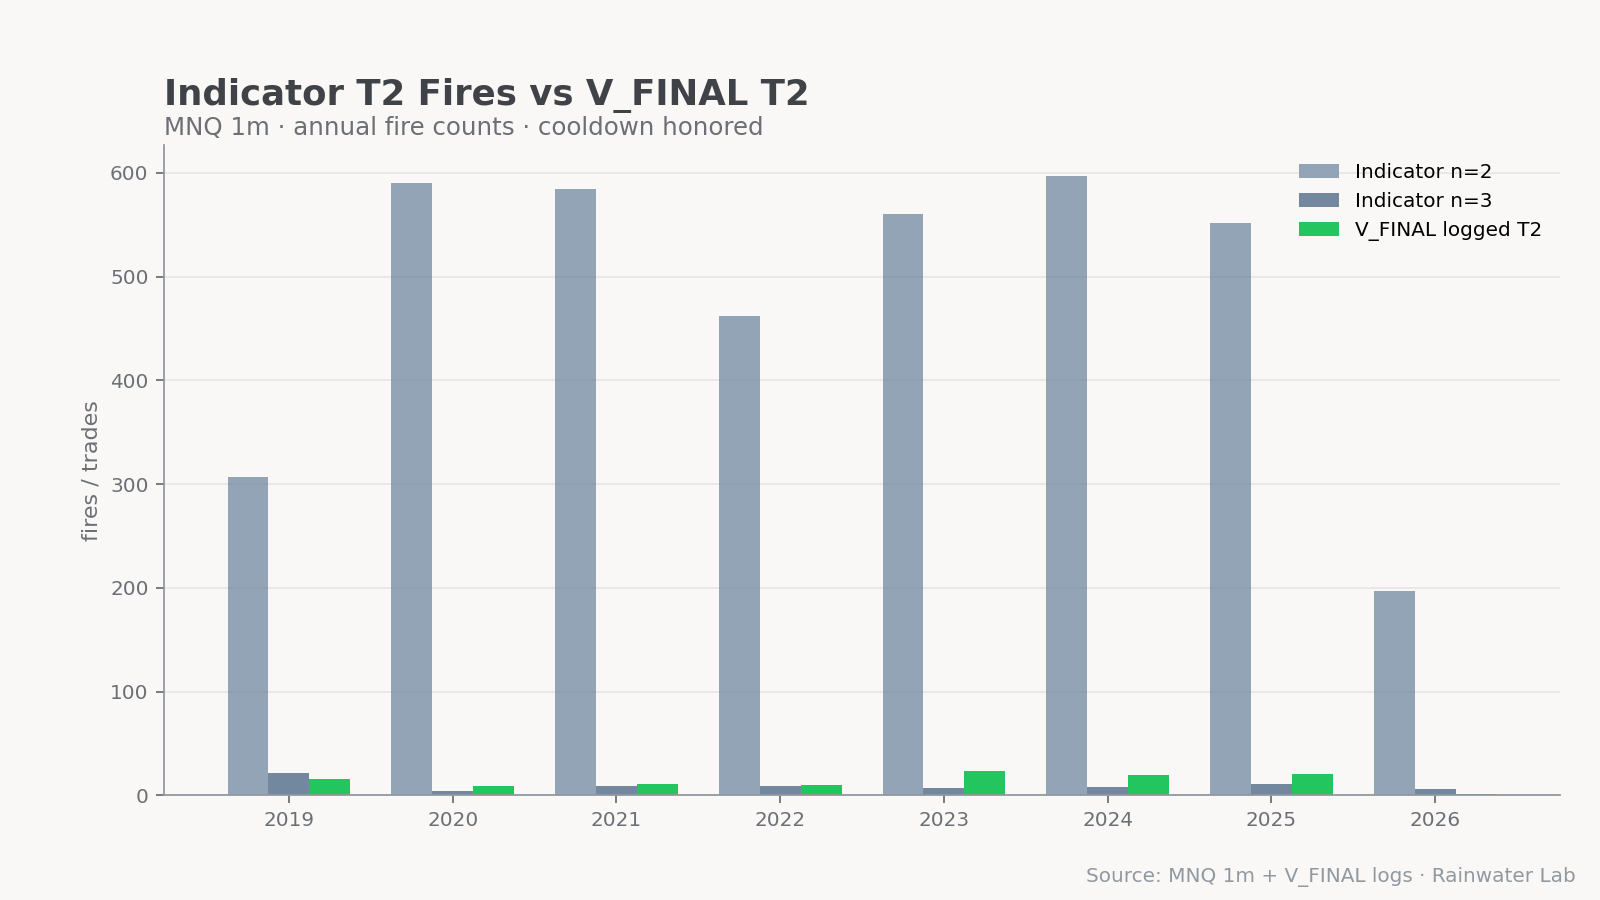
The chart paints triangles to show confluence forming. The strategy takes 14 of them per year. Eye-trading the rest would have cost the desk roughly $2,350 a year for the privilege of feeling busy.
Test 2 — the exit rule. V_FINAL was right here too.
On a strong trend-up day, V_FINAL's A+ targets hit fast and price keeps grinding higher for hours. The visible giveaway hurts. We designed a regime-gated exit replacement we called V2: on above_ema_8 days, drop the fixed target, hold to 16:00 ET RTH close, trail with the 5-min EMA-21. On non-regime days, fall back to V_FINAL's existing logic.
Tested on a noise cohort first (the 3,849 n=2 fires V_FINAL skips), V2 turned that cohort from −$16,526 into +$8,106 — a +$24,632 swing from one rule change. That looked like a flagship finding.
So we applied V2 to V_FINAL's actual logged entries.
T2 lift
+$3,890
below the $5K random-control trigger
A+ lift
−$19,232
kills the rule
Strategy-wide
−$15,342
the exit change is net-negative
Per-year stability change
8/8 → 5/8
worse in years that mattered
A+ trades have empirically the right exit profile already. The fixed targets win because they capture momentum on the bars that matter and avoid giving back on intraday reversals — V_FINAL is selecting the entries where targets-then-flat outperforms hold-and-trail. V2 looked great on noise because any hold-longer rule beats a tight stop-target on random entries when the broader regime is bullish. Applied to quality entries, the same rule gives the edge back.
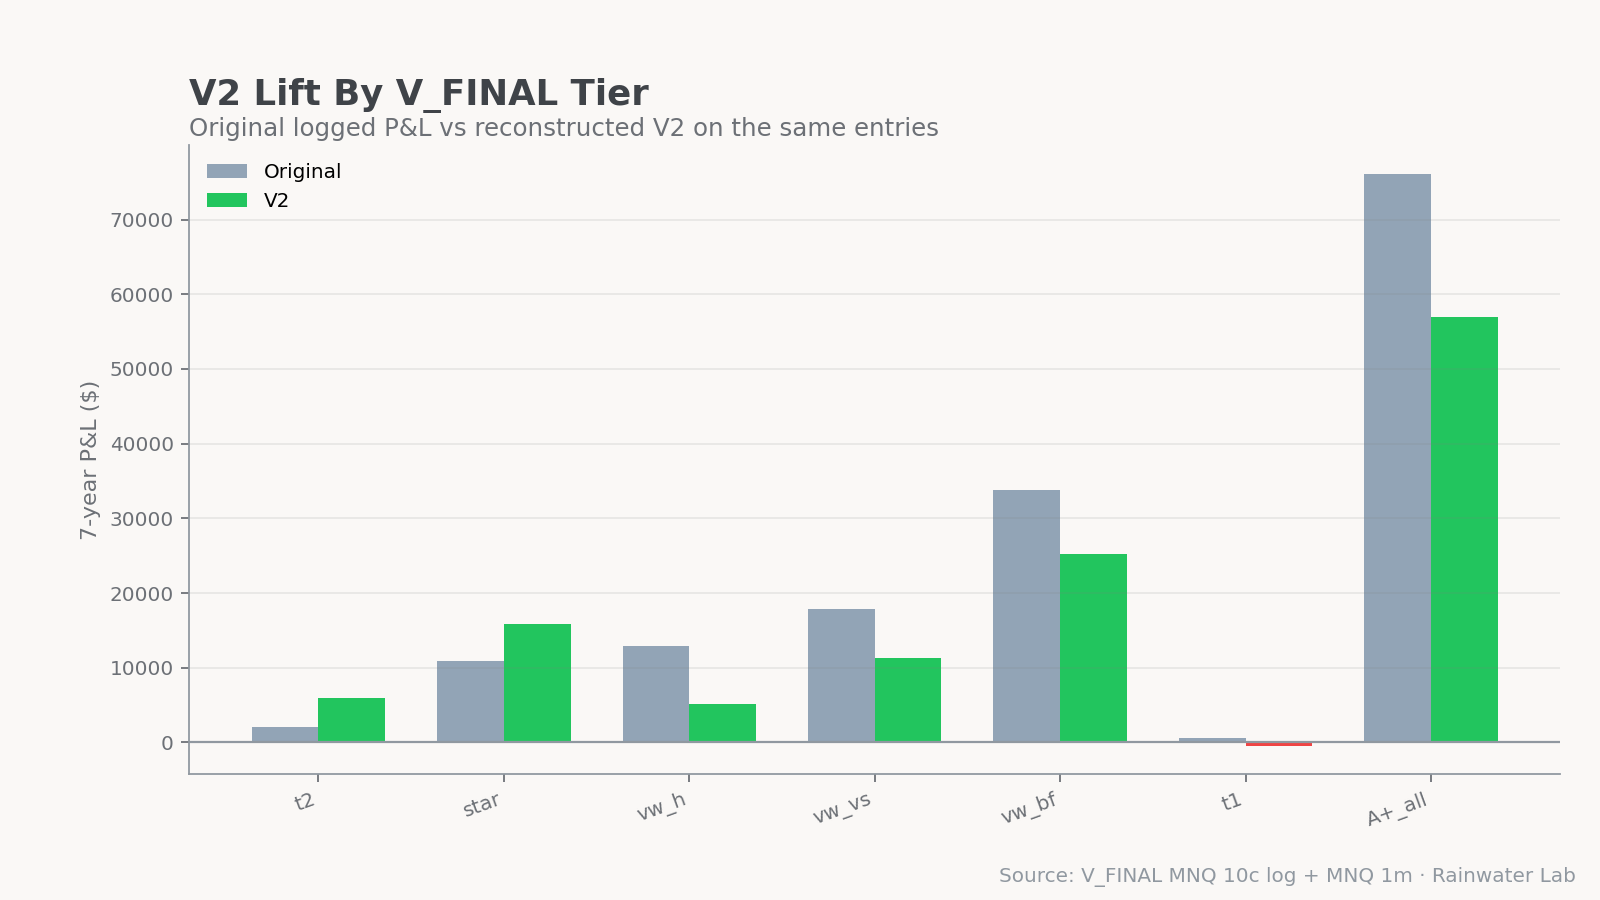
Same shape lesson as the entry test: the gate is doing the work. V_FINAL's A+ entries are pre-selected for the move structure where small targets pay better than long holds. Replacing their exits with a generically attractive trail throws away the selection effect.
Test 3 — the idle days. The wrong answer first.
V_FINAL is flat 65 % of sessions. The frequency miner asked: of those 1,155 idle days, how many contain triggers we could mechanically take that survive 95th-percentile random-control?
The first pass — the broad inventory — found a lot:
Active days lifted
38.1% → 63.8%
almost the desk's 66-70% goal
Added trades
456
across 456 new sessions
Added P&L
+$18,792
real, after slip + commission
Average trade
$41.21
too thin for the book we want
On paper, that solves the founder's question. Almost. The broad layer adds $18,792 and pushes coverage past 63 %. Under the conservative 1x framing, that would put the stack at$33,520.75 before the later quality pass. Coverage hits the goal. The desk fires on 6 out of every 10 sessions instead of 4.
But the added slice averaged only $41.21 per trade. The frequency miner was diluting the book. The math worked because volume covered for thin per-trade economics — not because the new trades were V_FINAL-quality. That's the kind of "improvement" that looks clean in a backtest and dies in live execution the first time slippage runs hot or the desk has a drawdown month and the small trades stop covering for each other.
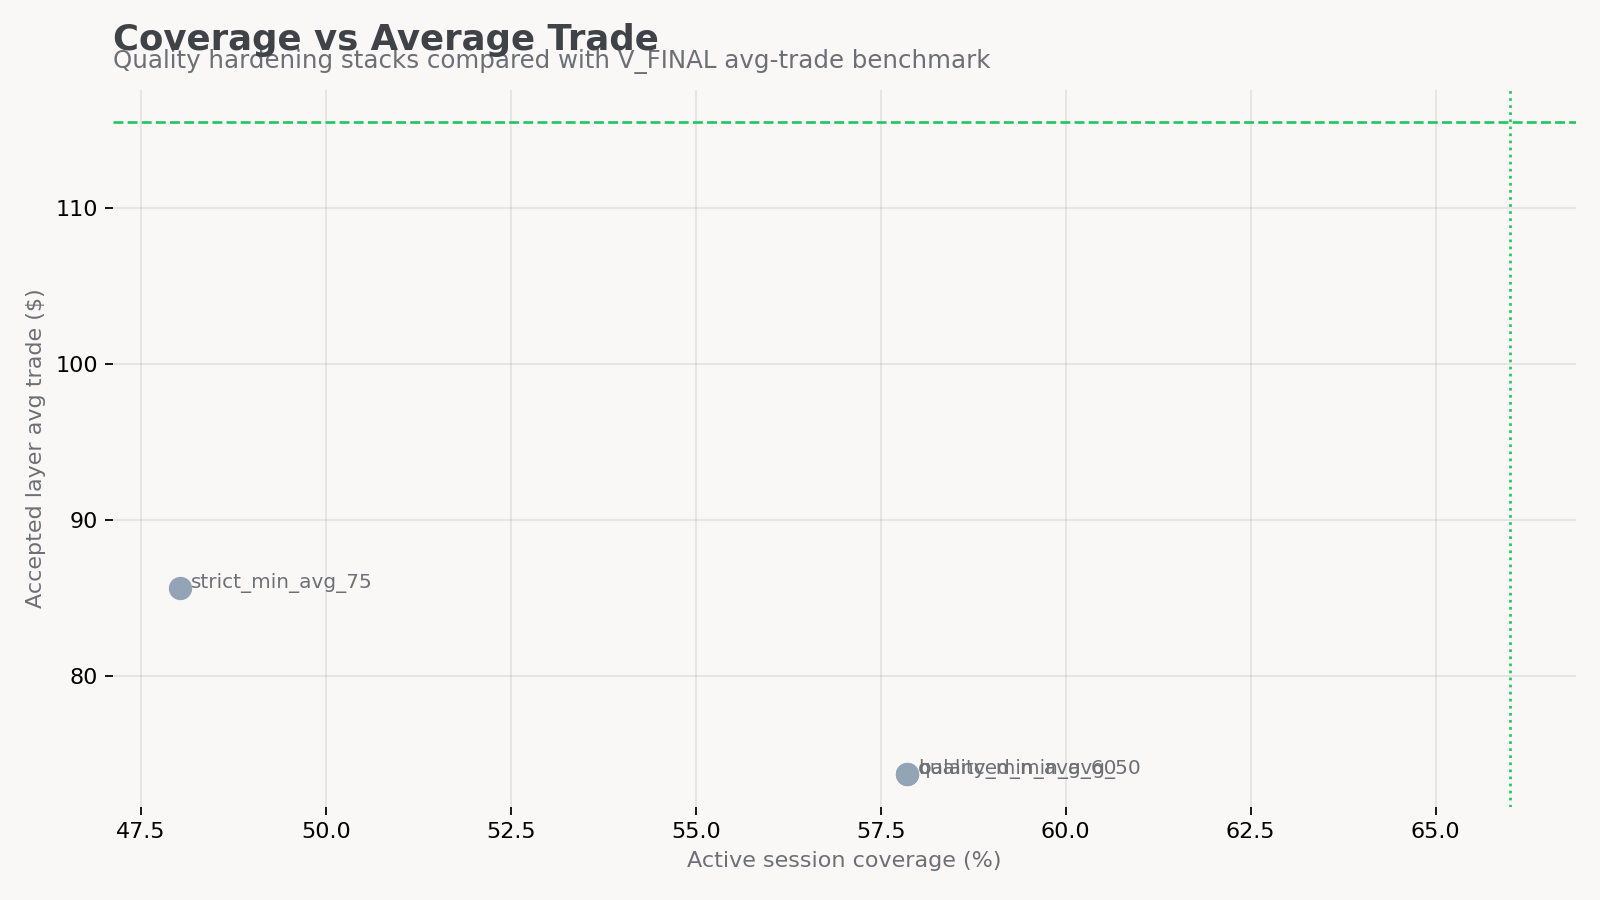
Test 3 — the right answer second.
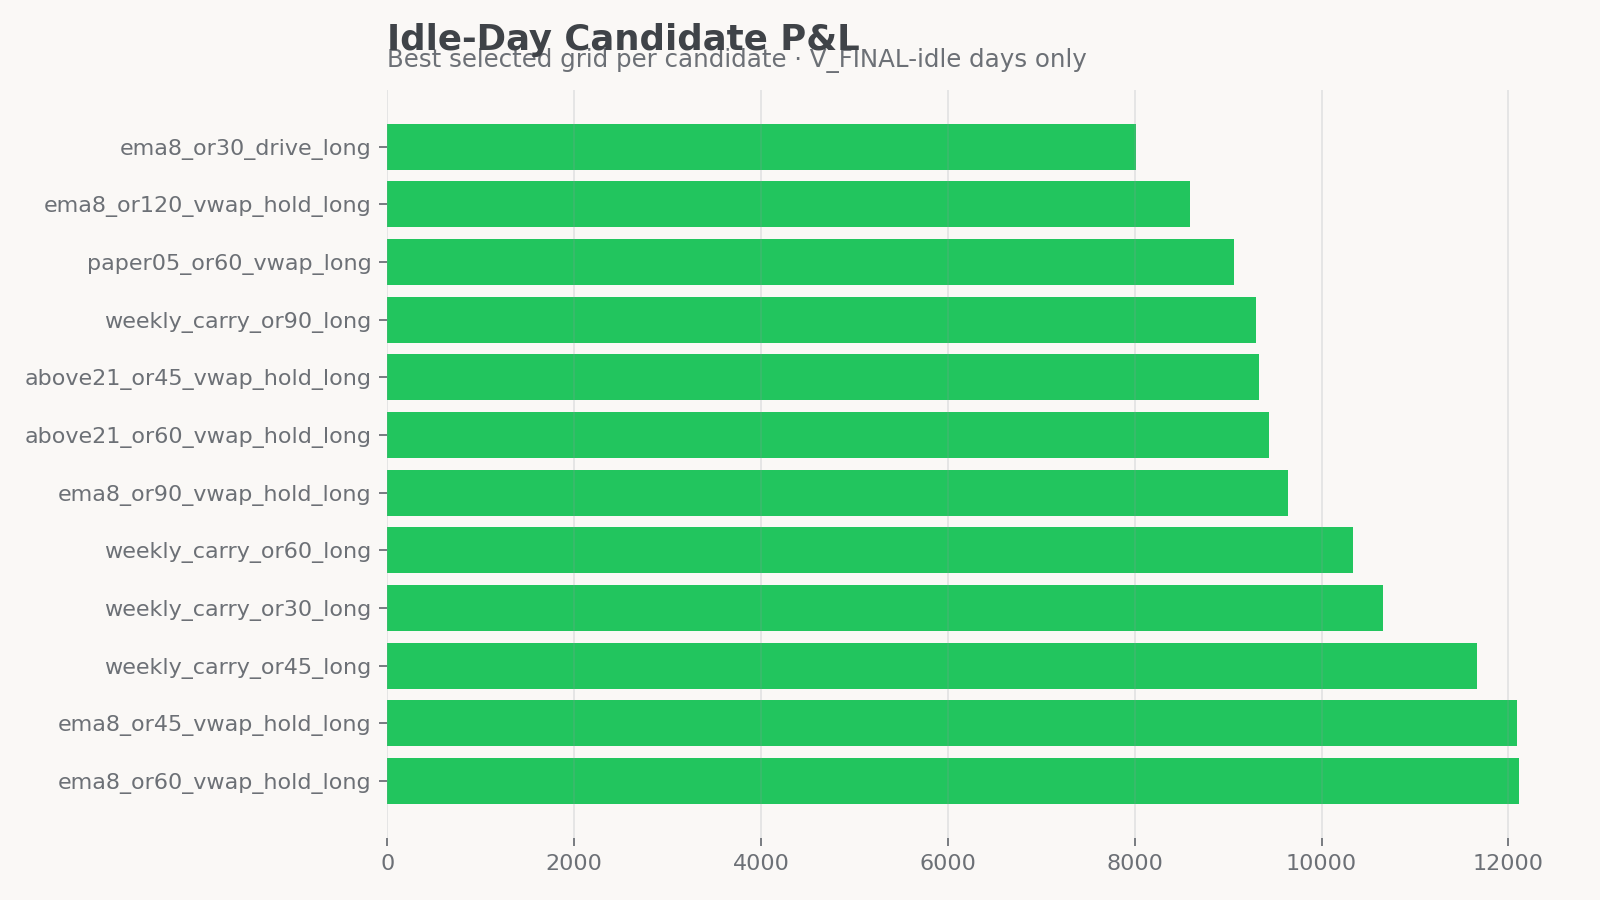
We re-ran the miner with one extra criterion: every accepted layer had to print at least $60/trade on the remaining stack slice (after V_FINAL + Q4 shorts had already taken their trades). That filter killed half the candidates. The other half became the quality stack — four mechanical rules, each one tested, each one orthogonal to the others, each one surviving 95 %-percentile random-control on its own gate set.
Added trades
350
across 350 new sessions
Added P&L
+$25,802
more dollars than the broad pass
Average trade
$73.72
vs $41.21 broad; above the $60 floor
Active-day coverage
57.9%
short of the 66-70% goal, on purpose
More dollars than the broad version, with fewer trades. Under the conservative stack framing, the final book is $40,530.75 at 1x and $79,932.00 at the hard 2x cap. The older $161,269 figure belongs to the live-style research run; it stays in the dossier, but it is not the deployment number on this page.
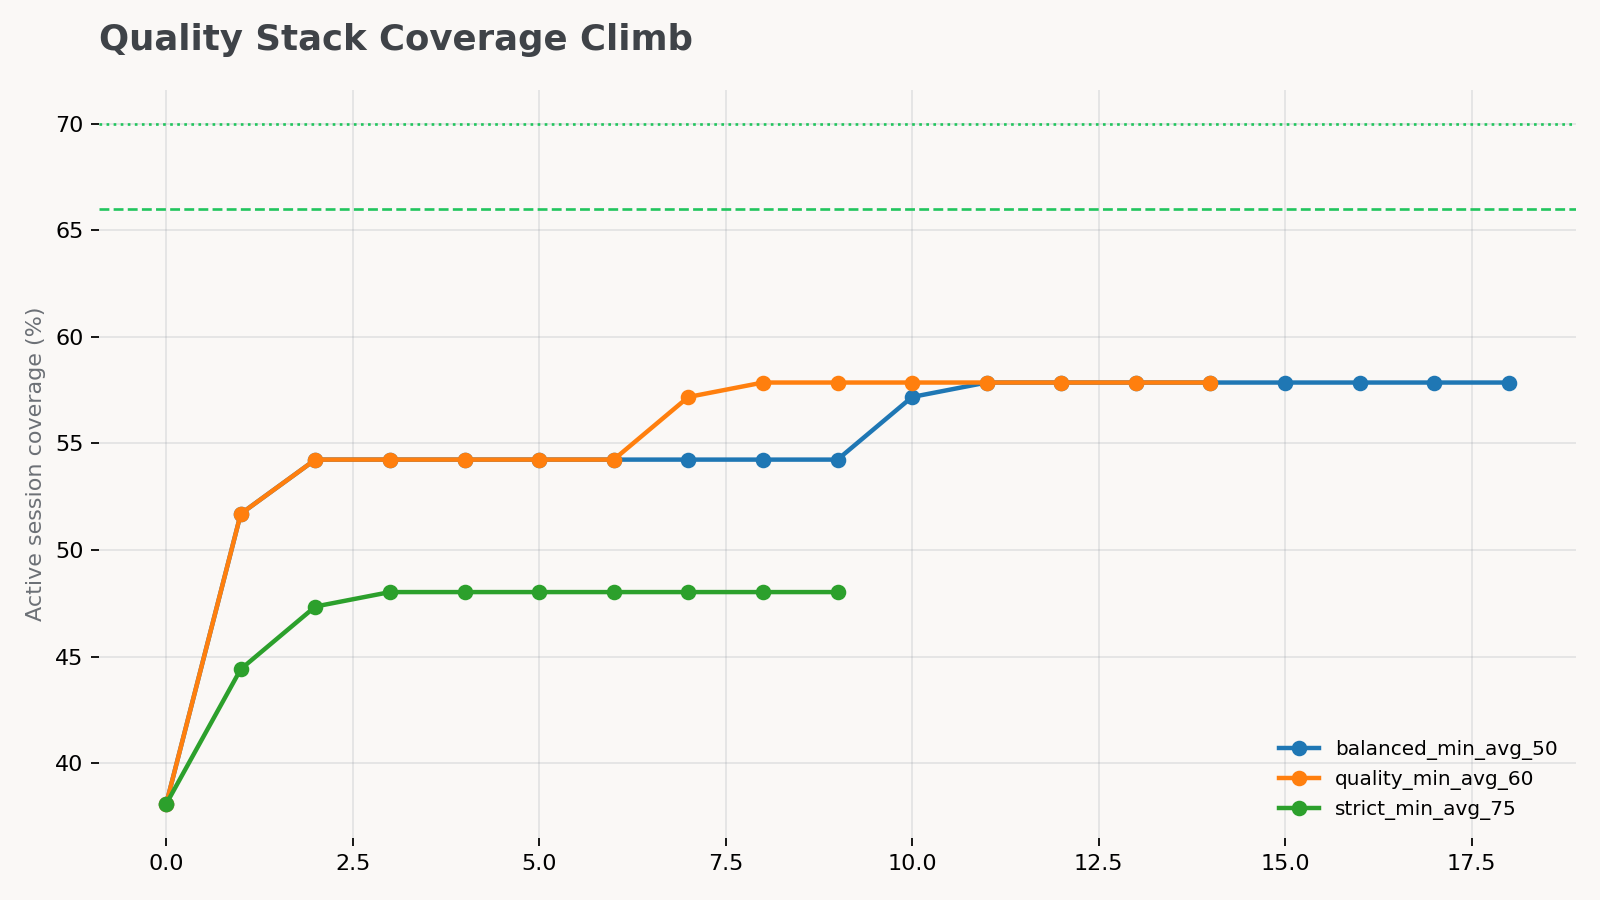
We didn't solve the one-trade-a-day goal. We found the first statistically defensible layer that makes V_FINAL materially less quiet without watering it down. The cost was 6 % of coverage. The payoff was $7,000 of additional P&L on the same calendar.
The four accepted rules
All rules are one trade per qualifying idle day, one MNQ contract per trade in the study, costs included. They only fire on days where neither V_FINAL nor the Q4 short module has already taken a trade. Stops and targets are in MNQ points. Time exit is end of RTH session.
1. Above-EMA8 OR45 VWAP-Hold Long
Daily gate: prior daily NQ close above its 8-period EMA (Paper 06 regime). Trigger: at the 10:14 ET close (45 min after open), OR45 close is above session VWAP, OR45 close sits at least 45 % up inside the OR45 range, and the OR45 range is at least 60 MNQ pts. Direction: long. Stop: 90 pts. Target: 150 pts.
Result: 241 trades · +$16,518.50 · 64.3 % win rate · $68.54/trade. The workhorse of the quality stack.
2. Above-EMA8 OR60 VWAP-Hold Long
Daily gate: same as #1. Trigger: at the 10:29 ET close (60 min after open), OR60 close is above session VWAP and at least 45 % up inside its range, with OR60 range ≥ 80 MNQ pts. Direction: long. Stop: 90 pts. Target: 150 pts.
Result: 45 trades · +$3,573 · 60.0 % win rate · $79.40/trade. The slower variant. Lower count, slightly higher per-trade.
3. Trend-Down OR45 VWAP-Loss Short
Daily gate: trend-down regime label. Trigger: at 10:14 ET close, OR45 close below session VWAP, weak (close in the bottom 35 % of OR45 range). Direction: short. Stop: 90 pts. Target: 120 pts.
Result: 52 trades · +$4,718.50 · 67.3 % win rate · $90.74/trade. The highest per-trade contribution in the stack. Lives on the opposite regime from #1 and #2.
4. Q4 OR45 Short
Daily gate: Q4 extended-pullback regime. Trigger: at 10:14 ET close, OR45 return is negative and OR45 closes in the bottom quartile of its range. Direction: short. Stop: 75 pts. Target: 120 pts.
Result: 12 trades · +$992 · 66.7 % win rate · $82.67/trade. The smallest contribution. Tight regime, narrow universe — but clears the bar.
What we deliberately did NOT ship
Paper 05 set the precedent: nulls ship. This paper produced more of them than positives. Listing what failed is the part that keeps the paper credible.
- STRAT 02: 5m EMA-21 / VWAP bounces. The first attempt to add idle-day longs. Both setups made money standalone but failed the 95 %-percentile random-control bar — random long entries on
above_ema_8days print on their own. The "bounce" filter wasn't adding edge over the regime gate. - STRAT 03: trend-day re-entries on V_FINAL-idle days. We narrowed the universe to extreme trend-up days where price never returned to VWAP. Only 24 sessions qualified across 7 years — below the publishing-floor sample size. Killed at the day-set gate.
- The exit-rule application. See Test 2. The biggest disappointment — the rule looked spectacular on a noise cohort and gave back $19K of A+ when applied to real entries.
- Late-day levels and compression breaks. Prior-day level reclaims, post-10:30 VWAP loss/reclaim reversals, OR60 breakouts, volatility-compression expansion. Several variants looked tempting in raw form. None added non-overlapping P&L after the quality stack.
- Session classifier. A standalone first-hour router that picks long, short, or no-trade for the day cleared random-control on its own (99.4 percentile) but only added 19 non-overlapping trades for $1,328 once the quality stack was in place. Useful future lens; not a current stack layer.
- Volume profile and 5-minute structure. First-60-min volume profile acceptance above VAH/POC, Q4 / trend-down rejections below VAL/POC, 5-minute bull flags and bear flags entered on 1-min confirmation. The cleanest standalone candidate — Q4 VAL rejection short, 40 trades at 77.5 % win rate, +$5,164 — landed at the 94.2nd percentile of same-gate random control, just short of the 95 % bar. Three other variants were closer to 86-93. Zero added trades after the quality stack absorbed the regime-gate signal.
The pattern across this paper is the same one Paper 05 documented: when V_FINAL's gates are already eating a signal, additional filters that ride on the same signal don't add edge — they just repackage it. New layers have to bring orthogonal information, and most setups don't.
What ships, and what's queued
From this study, the desk's seven-year small-cap book looks like this:
V_FINAL 1x cap
$8,788
63.7% WR · 34.8% active days
+ STRAT04
$14,729
adds $5,940 · 38.1% active days
+ quality stack
$40,531
adds $25,802 · 57.9% active days
Hard 2x cap
$79,932
same trades · 64.7% WR
The quality stack is a candidate. Before any of these four rules touches the live copier, they need:
- Re-port into the canonical V_FINAL backtest framework (the research code lives in a separate harness)
- Audit for timestamp leakage, session-boundary mismatch, regime-label drift
- Paper-trade the layer separately from V_FINAL for a defined window before any merge
The Q4 short module — discussed in Test 1's stack baseline — is on the same hardening track. Both will get their own deploy posts when the framework re-port and the paper-trade soak are done. Until then, the live desk runs V_FINAL with the Paper 06 above_ema_8 sizing overlay, exactly as it did on the day Paper 06 shipped.
Interactive research tape
The chart below is here for research, not marketing. It loads the seven-year stack equity, then lets the desk inspect exact 1-minute candles for every timestamped STRAT04 and quality-stack trade. V_FINAL is included in the equity and performance stats, but its canonical small-cap log is date-only, so those entries are not drawn as intraday markers yet.
The take-home
We started this study suspecting V_FINAL was leaving real money on the table at the entry, the exit, or both. The data said no on both counts. The chart's blue triangles you see all day on trend-up sessions are mostly noise. The fixed-target A+ exits are empirically what makes A+ profitable. Where you'd expect V_FINAL to be wrong is where it turns out to be right.
The actual money was in the 65 % of sessions V_FINAL was idle — and even there, the obvious version of "more trades" diluted the book past the point of being a real improvement. The version that paid was the one that refused any candidate that couldn't carry $60/trade in average expectancy, and accepted only four rules out of dozens we tested.
More trades was the wrong goal. Better-quality additions were the goal. The paper's finding is the four-rule quality stack — but the paper's lesson is that we threw away the higher-coverage version on the way to it.
Paper 05 said the desk's discipline is the trades it refuses. Paper 07 says the same thing, applied to research itself: the layers we refused to ship are what made the layer we shipped meaningful.
Futures waitlist
We're not running futures live yet. When we do, you'll be the first to know.
The research above is what we measure before we run a single dollar of subscriber money. Drop your email if you want first access when MNQ goes live on the desk.
Email only used for futures launch notifications. Unsubscribe any time.