Paper 05 · 14 min read · April 29, 2026
The day before tells you. But you already knew.
A 7-year, 4-agent study on whether pre-market signals can flag long-hostile days. The signal is real. The filter that uses it loses money. The rule we shipped instead. And a human checklist for the days the desk doesn't show up long.
Days studied
1,769
Bad-for-longs
354
OOS lift shipped
+$28,850
Years positive
5 of 5
The question
Some sessions never give the long side a real shot. Price tags VWAP for a minute, fails, and rolls the rest of the morning. The desk's existing playbook handles those days defensively — the 15-minute bias filter rejects most long entries when trend is against them — but defense isn't the same thing as understanding.
So we asked the data a direct question. Can pre-market signals, knowable before 9:30 ET, identify the days that will be hostile to longs? If yes, we get a useful filter and the foundation for any future short-bias module. If no, we save ourselves from shipping a rule that doesn't pay.
The signal is real. The filter that uses it loses money. The reason is more interesting than either result alone — and the rule we shipped instead is the simplest line of code in the playbook.
The method — four agents, two methods, one feature
We ran the study four ways so the conclusions wouldn't depend on any one analyst's choices.
- Top-down classifier. Build a per-day labeled dataset (did a long VWAP-reclaim hold for 30+ minutes during 9:30–12:30?), engineer pre-market features, train logistic + tree models with walk-forward 5-fold validation. Test economically against V_FINAL's actual trade log.
- Bottom-up clustering. Score every session for long-friendliness. Pull the worst 20 % (354 days). Ask what those days had in common pre-open. Cluster within the cohort to find archetypes.
- Inverse upsize backtest. Once a feature was named by the first two methods, test the obvious follow-up: when the same signal points the other way, does upsizing on green-trend days print?
- Human-trader playbook. Walk the bad-day cohort bar-by-bar. Tag the recurring intraday short setups, time them, measure how far each move runs. Build a discretionary checklist for a tape reader.
Two methods agreeing without coordination is the strongest evidence a noisy dataset will give you. Both the classifier and the clustering surfaced the same dominant signal as their #1 feature, which sets up the rest of the paper.
The convergent finding — last week's tape predicts this morning's
Top feature (both methods)
ret_5d
5-day NQ return
Effect size (Cohen's d)
0.66
Large by social-science standards
Walk-forward AUC
0.66
Modest but stable
Bottom-quintile no-hold rate
49%
vs 18% on top quintile
When the past five trading days on the Nasdaq have been net negative, the next session is statistically hostile to long VWAP-reclaims — and the relationship is monotonic. Sort all 1,769 sessions into deciles by 5-day return. The decile of weakest 5-day-trend days shows a 49 % no-hold rate. The decile of strongest 5-day-trend days shows 18 %. Every step in between moves in the expected direction, and the pattern holds out-of-sample across all five test years.
Realized volatility (also 5-day) is the next strongest signal: bad-for-longs days average 23.9 % annualized vol vs 17.6 % on the rest. Wider Globex range and gap-down openings ≥ 0.5 % are smaller-effect-size confirmations of the same regime story.
Several intuitive features didn't survive correction: day-after-FOMC, prior-day-close position in range, pre-market 90-minute slope, and prior-day signed return all looked promising in isolation but failed once we adjusted for testing 20+ features. The discipline of multiple-comparison correction killed half of our starting hypotheses, which is exactly what it's supposed to do.
The negative result — why the obvious filter loses money
Here is the turn. We built the classifier, we validated it, we ran the economic test on V_FINAL's real MNQ trade log over five out-of-sample years. The natural use is “flag a bad-for-longs day, skip the day's longs, save the loss.”
That use loses money. Every threshold we tested — top 50 %, top 30 %, top 10 %, top 5 % of predicted no-hold probability — produced a negative P&L delta vs the unfiltered baseline. Range: −$275 to −$17,270 over five years at 10 MNQ. Only the top-2 % extreme tail broke even (+$290).
The reason is a simple selection effect we should have predicted. V_FINAL's existing 15-minute EMA-21 bias filter already rejects most long entries on these days at the gate — the filter ate the signal before our classifier got to it. The longs that do fire on flagged days are the survivors that passed the bias check, and they print 55 % win rate at +$84 per trade. Skipping those is skipping winners.
Translation: the bias filter ate this signal already. Our classifier was fishing in a pond someone already drained. Honest negative result — and the reason it's negative is a vote of confidence in the existing playbook.
The rule we shipped — same signal, opposite direction
If skipping bad days is a wash, what about upsizing on the good ones? The same 5-day-trend feature, used in reverse: when the past week has been the strongest 30 % of the trailing year on the Nasdaq, the next session is statistically cleaner for longs. The desk's A+ setups print harder on those days because the regime tailwind compounds into the setup edge.
We ran 500 random per-year-stratified upsize trials at every threshold and multiplier so we'd know whether any apparent edge was real or just mechanical scaling. The 5-day-trend rule beat the random-day baseline at the 99.4th percentile. The classifier itself, used as an upsize signal, was indistinguishable from random. Pure feature alpha lives in ret_5d; the classifier was just repackaging it.
Rule (default)
Top 30% × 2×
A+ contracts only
OOS lift, 5 yrs, 10 MNQ
+$28,850
5/5 years positive
Aggressive (3× sizing)
+$57,700
Peak DD ~$1,925
2022 (worst baseline)
+165%
Rule shores up the year that needed it
One signal. One line of code. Computed once per day at 9:30 ET from NQ daily continuous data. If today's trailing 5-day return on NQ is at or above the 70th percentile of the last 252 trading days, double A+ contract size. Otherwise leave size alone. T2 (the smaller confluence trade) keeps its size unchanged. Every other V_FINAL rail — circuit breakers, bias filter, 12:30 cutoff — runs as is.
The result that matters most is stability. The rule prints positive P&L in all five out-of-sample years (2021 through 2025). It adds the most absolute dollars in 2022, V_FINAL's worst baseline year — exactly the year the desk needed it. Under doubled slippage assumptions the lift barely moves. We are not going to find a more robust regime overlay than this in a 7-year window.
What we deliberately did NOT ship
Three rules tested clean and were dropped after the economic check:
- The skip-longs filter. See above — it negates winners that the bias gate already filtered.
- The classifier as an upsize signal. When we tested it against 500 random per-year-stratified upsize trials, random days beat it 41 % of the time. Once we accounted for the mechanical “sizing 30 % of any days at 3× scales total P&L by 1.6×” effect, the classifier itself added no edge. The signal lives in the underlying feature (
ret_5d), not in the model. - T2 downsize on weak-trend days. Sounded reasonable. Under V_FINAL the bias filter already prevents almost all T2 entries on weak-trend days — only 2 T2 trades over five years would have been affected. The change costs more attention than it saves dollars.
The discipline finding from earlier papers stands: the strategy is partially what it takes; mostly what it refuses to.
The human side — what to do on the days the desk sits out
V_FINAL's bias filter pulls the desk's hand off the keyboard on flagged bad-for-longs days. That is correct behavior for a deterministic system. But a human reading the tape can still make money on those days from the short side — discretionarily, with eyes on the chart, on a different timeframe than the strategy.
We walked all 354 worst-for-longs days bar-by-bar. Every single one of them fired at least one of five recurring short archetypes during 9:30–12:30 ET. The job isn't whether to short on a flagged day. The job is which setup, when, and where to stop.
Bear flag breakdown
86%
of bad days fired this
VWAP rejection from above
83%
the bread and butter
Lower-high after drive
51%
highest quality moves
Trend-day continuation
34%
the gap-down-and-go days
The five archetypes (with examples)
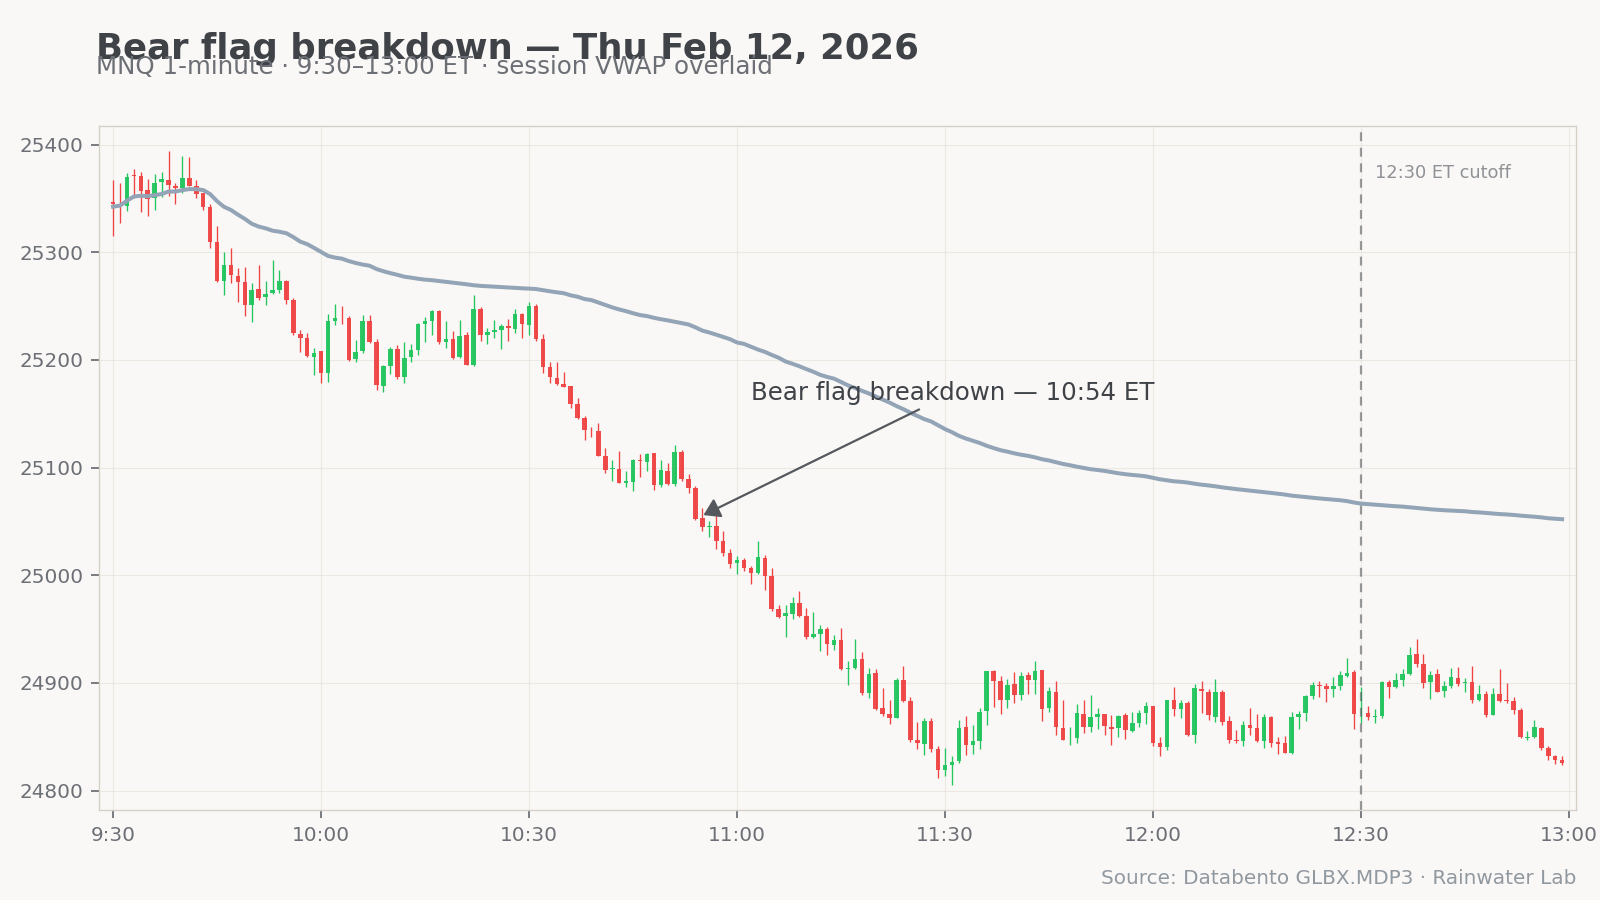
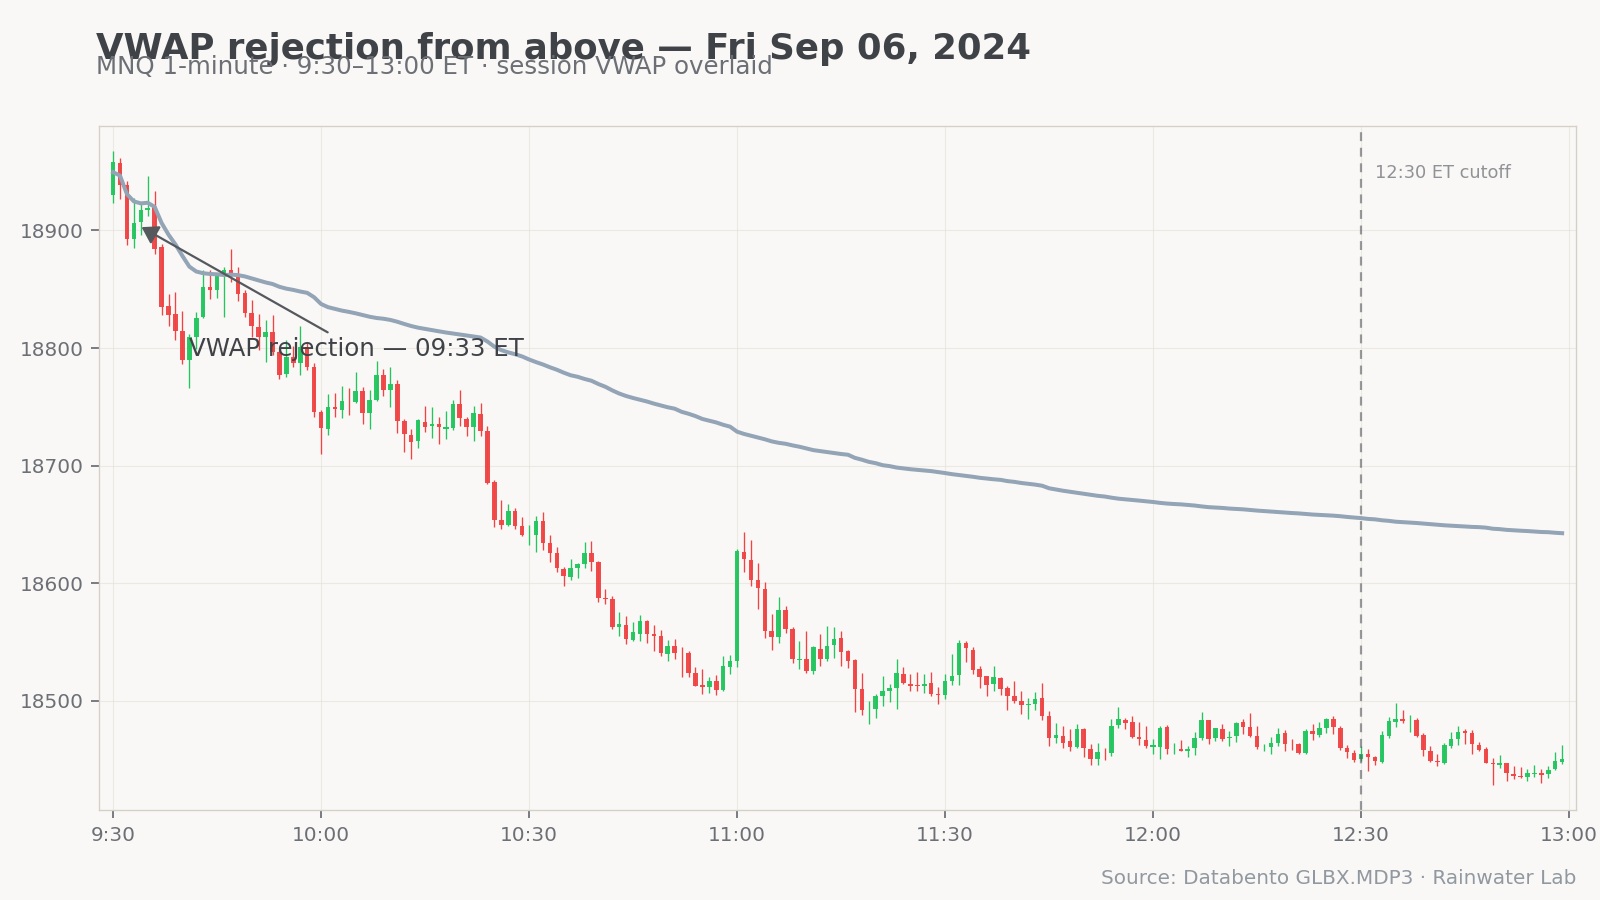
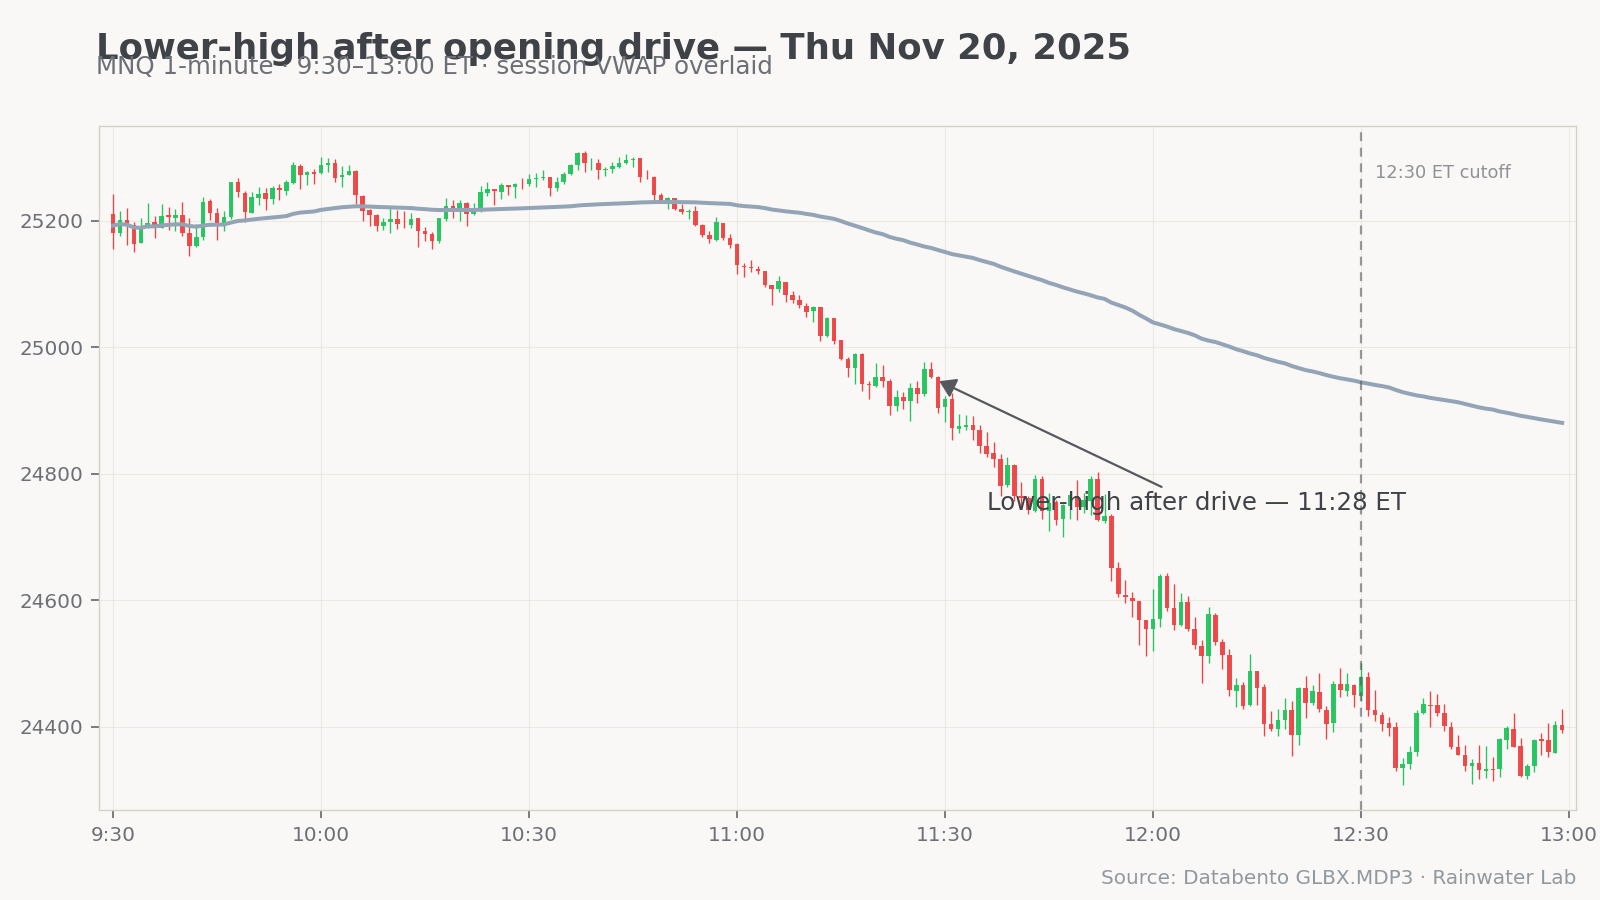
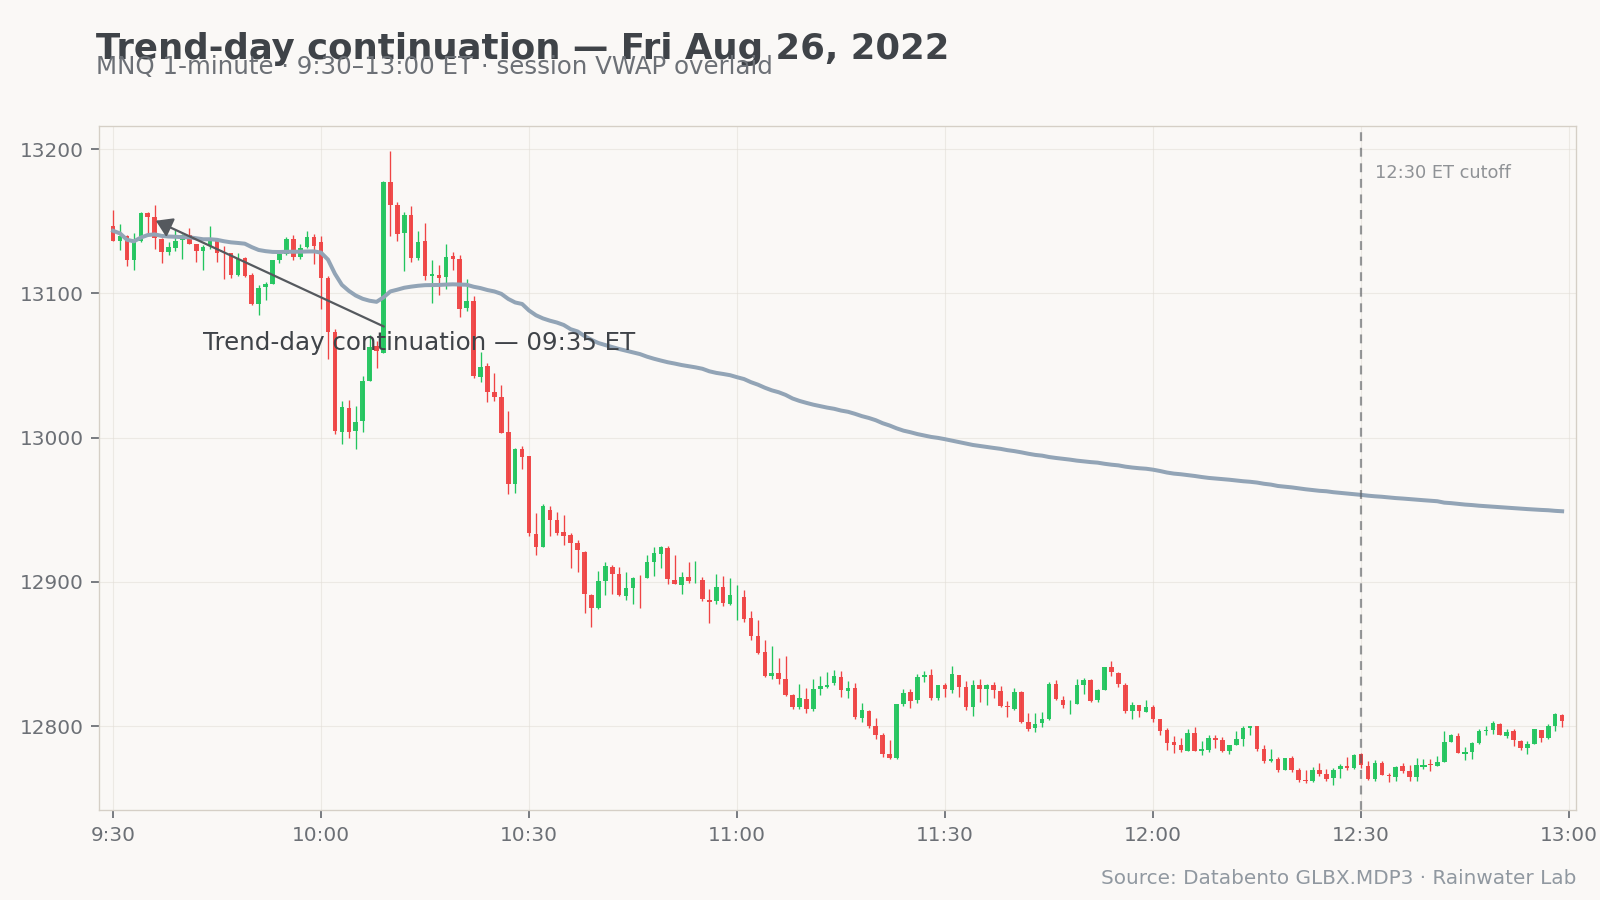
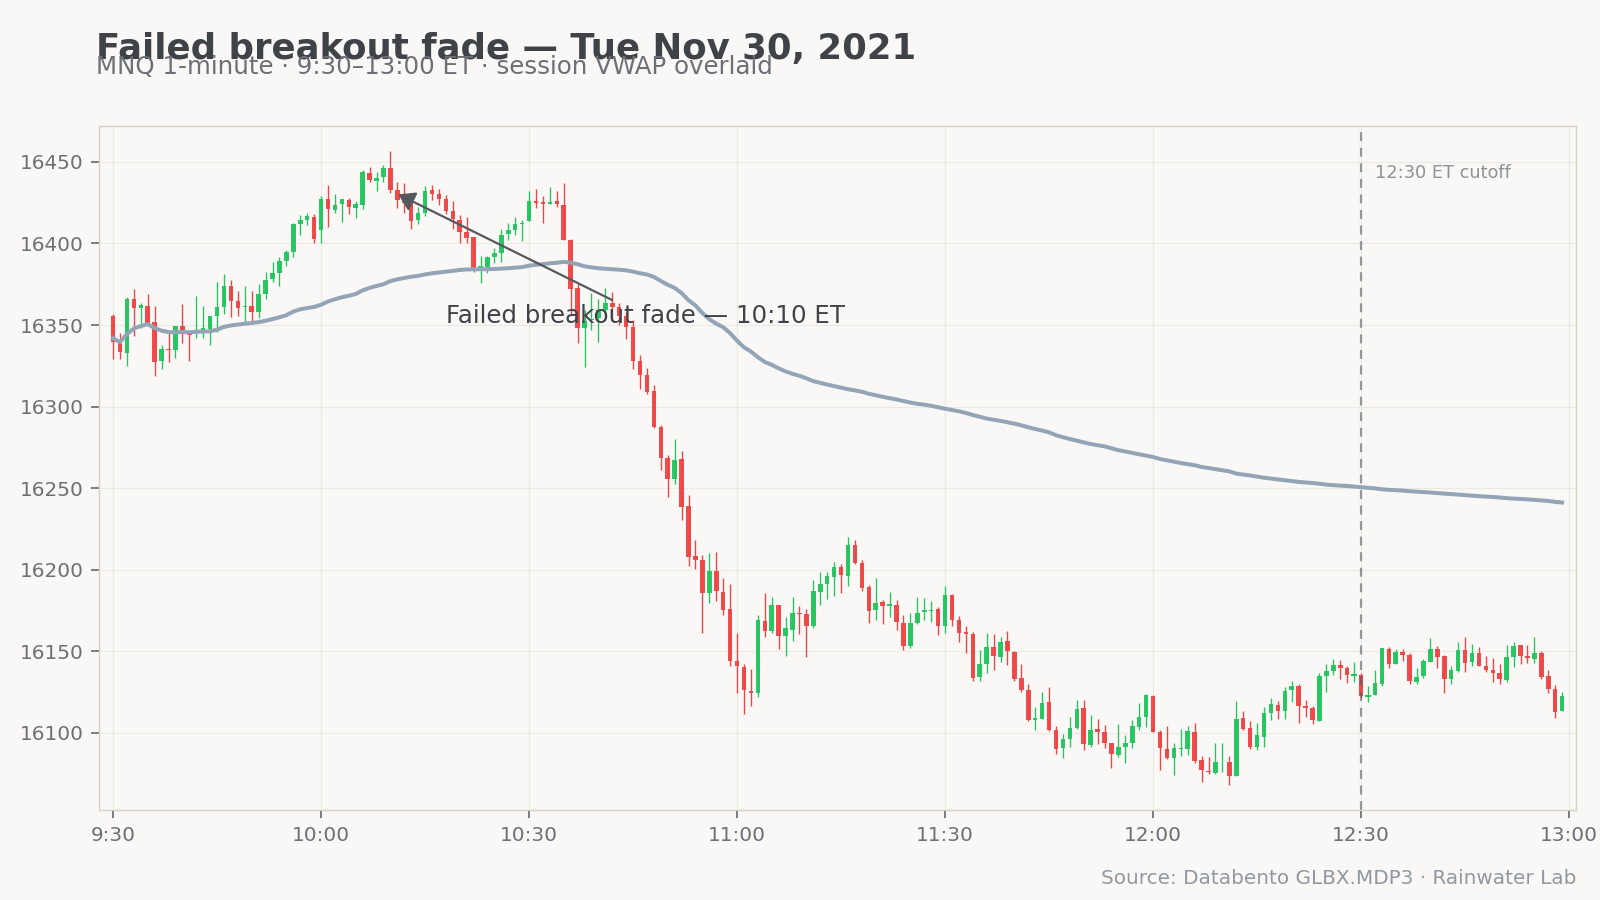
Each archetype below is followed by a real example from the cohort — a clean session that fired the setup and held the bear thesis through 12:30. Charts are MNQ 1-minute bars, 9:30–13:00 ET, with session VWAP overlaid. The arrow points to the trigger bar.
1. Bear flag breakdown — the workhorse
After 10:00 ET, look for any 10-bar window with high-low range ≤ 0.25 % of price and a top below the morning high. That's a tight consolidation that is not a bull flag. The setup completes when price closes ≥ 4 MNQ points below the consolidation low within five bars.
Frequency on flagged days: 86 % · Avg favorable move (next 30 min): 56 pts · Adverse first: 30 pts.
2. VWAP rejection from above — the most reliable trigger
Price has been below session VWAP for two-plus bars (the bear is already in control). Price tags or briefly closes above VWAP, but spends ≤ 2 bars above and never extends more than ~0.30 % above before closing back below. The textbook rejection-of-the-reclaim.
Frequency on flagged days: 83 % · Avg favorable move (next 30 min): 84 pts · 97 % of fires ran ≥ 8 pts in the trader's favor.
3. Lower-high after the opening drive — the highest-quality move
The morning sets a real upside attempt — the first 30-minute high is at least 0.20 % above the 9:30 open. Then the next confirmed swing high prints at least 8 MNQ points below that morning high. The pop is failing.
Frequency on flagged days: 51 % · Avg favorable move (next 30 min): 99 pts · 100 % of fires ran ≥ 8 pts in the trader's favor — the highest of any archetype.
4. Trend-day continuation — gap-down-and-go
9:30 opens at or very near the morning low and stays there through the first 30 minutes — no real upside attempt of any size. The morning closes in the bottom 15 % of the 9:30–12:30 range. This is the canonical bear trend day. The setup declares itself by 9:35 ET; you trade pullbacks to VWAP, not the open print.
Frequency on flagged days: 34 % · Avg favorable move (next 30 min): 88 pts · When you see one, size up.
5. Failed breakout fade — the gap-up trap
Price tags prior-day high or premarket/Globex high, then closes back below the level by ≥ 8 MNQ points within 15 minutes. The classic stop-run-then-reverse. Rare, but very high-conviction when it shows up — it's the signature setup for the gap-up-trap cluster.
Frequency on flagged days: 12 % · Avg favorable move (next 30 min): 76 pts.
When to pull the trigger
Pooled across all five archetypes, the quality of intraday short triggers varies sharply by time of day:
9:30–10:00
515 fires
88 pts avg favorable
10:00–10:30
201 fires
73 pts avg
10:30–11:00
111 fires
59 pts avg
After 11:30
51 fires
shallower, riskier
The first hour is prime time. About 76 % of all archetype triggers fire between 9:30 and 10:30 ET, and the favorable excursion is largest in that window. The first half-hour also has the largest adverse excursion (~35 pts against you first), which is why we prefer waiting one bar of confirmation rather than firing on the trigger candle's tick. By 9:46 ET, three-quarters of all bad-for-longs days have already shown a confirmed short trigger. Half of them showed it by 9:35.
After 11:30 ET the trigger count and the move quality both fall sharply. After 12:30 ET we don't take new shorts at all. Of the 354 bad-for-longs days, 52 (15 %) saw an afternoon V-reversal: 12:30 was at or near the morning low, but 16:00 closed ≥ 0.4 % above that 12:30 print. Nothing in the pre-market features predicts which days will V-reverse. The 12:30 cutoff is the only protection.
The 1-page checklist
Print this. Tape it to the monitor. The discipline lives here.
Bad-for-longs day · short-bias playbook
PRE-MARKET (need 2 of 4):
  [ ]  Last week red on NQ/QQQ (5-day return < 0)
  [ ]  5-day realized vol elevated (~22% annualized)
  [ ]  Globex range > 1.0% of price
  [ ]  Cash gap-down ≥ 0.5%
  Bonus flags: Friday · day after a 2%+ down day

INTRADAY — first trigger wins. Watch in this order:

  9:30–9:35  TREND-DAY CONTINUATION  (~34% of cohort)
  9:30–10:30 VWAP REJECTION          (~83%, most common)
  9:45–10:45 LOWER HIGH AFTER DRIVE  (~51%, highest quality)
  10:00–11:00 FAILED BREAKOUT FADE   (~12%, gap-up traps)
  10:00–12:00 BEAR FLAG BREAKDOWN    (~86%, often a re-entry)

BEST WINDOW:    9:30–10:30 ET (~76% of triggers)
WAIT ONE BAR:   9:30–9:45 (high adverse excursion)
DON'T ADD AFTER: 11:30 ET (low count, shallow moves)

HARD RULES:
  ▸  Flat by 12:30 ET. No exceptions.
     (afternoon V-reversal hits ~15% of these days)
  ▸  If nothing has triggered by 11:00 AND price has held
     above VWAP 30+ minutes, stand down.
  ▸  Full gap-fill on a gap-down day = exit, not add.
  ▸  One trade per archetype. If your first VWAP rejection
     fails, don't re-short the next attempt.

OPENING-RANGE BREAK GUIDE (first 30 min):
  Down break before up break:  ~87% of bad days
  Up break first then fade:    ~13% (gap-up trap)
What we don't know yet
Three things this paper deliberately leaves on the table.
- The Quiet Ambush problem. 58 % of the worst bad-for-longs days have no clear pre-market tell. They open flat, grind lower in waves, and only confirm bear-bias somewhere in the 10:00–10:45 window. We have no edge in flagging these in advance — only in reading them once they're underway.
- V-reversal prediction. Pre-market features barely separate the 15 % of bad mornings that V-reverse from the 85 % that don't. The 12:30 cutoff is a discipline rule precisely because we don't have a predictive one.
- Programmatic shorts. Earlier research (F33, in the master findings file) showed that automated short setups historically print at 0.4–0.7 RR — they don't pay without a regime gate underneath them. A future paper might revisit short automation with this paper's regime layer underneath. Today, the short side stays human.
The take-home
The desk got two things out of this study. First, a single, one-line sizing rule that lifts V_FINAL P&L by ~$29K to ~$58K over five years at 10 MNQ contracts, with positive years across the board and robust slippage behavior. Second, a discretionary short-side checklist that's anchored in seven years of empirical structure, not gut feel.
And one negative result that's worth as much as either of the positives: a clean filter we built, validated, and refused to ship because the data said it wasn't accretive. That refusal is the part of this paper we're proudest of.
The day before tells you. But the desk already knew. The new rule is the one we found while figuring that out.
Futures waitlist
We're not running futures live yet. When we do, you'll be the first to know.
The research above is what we measure before we run a single dollar of subscriber money. Drop your email if you want first access when MNQ goes live on the desk.
Email only used for futures launch notifications. Unsubscribe any time.